
Figure 4. Functional mechanisms of genetic regulatory effects.
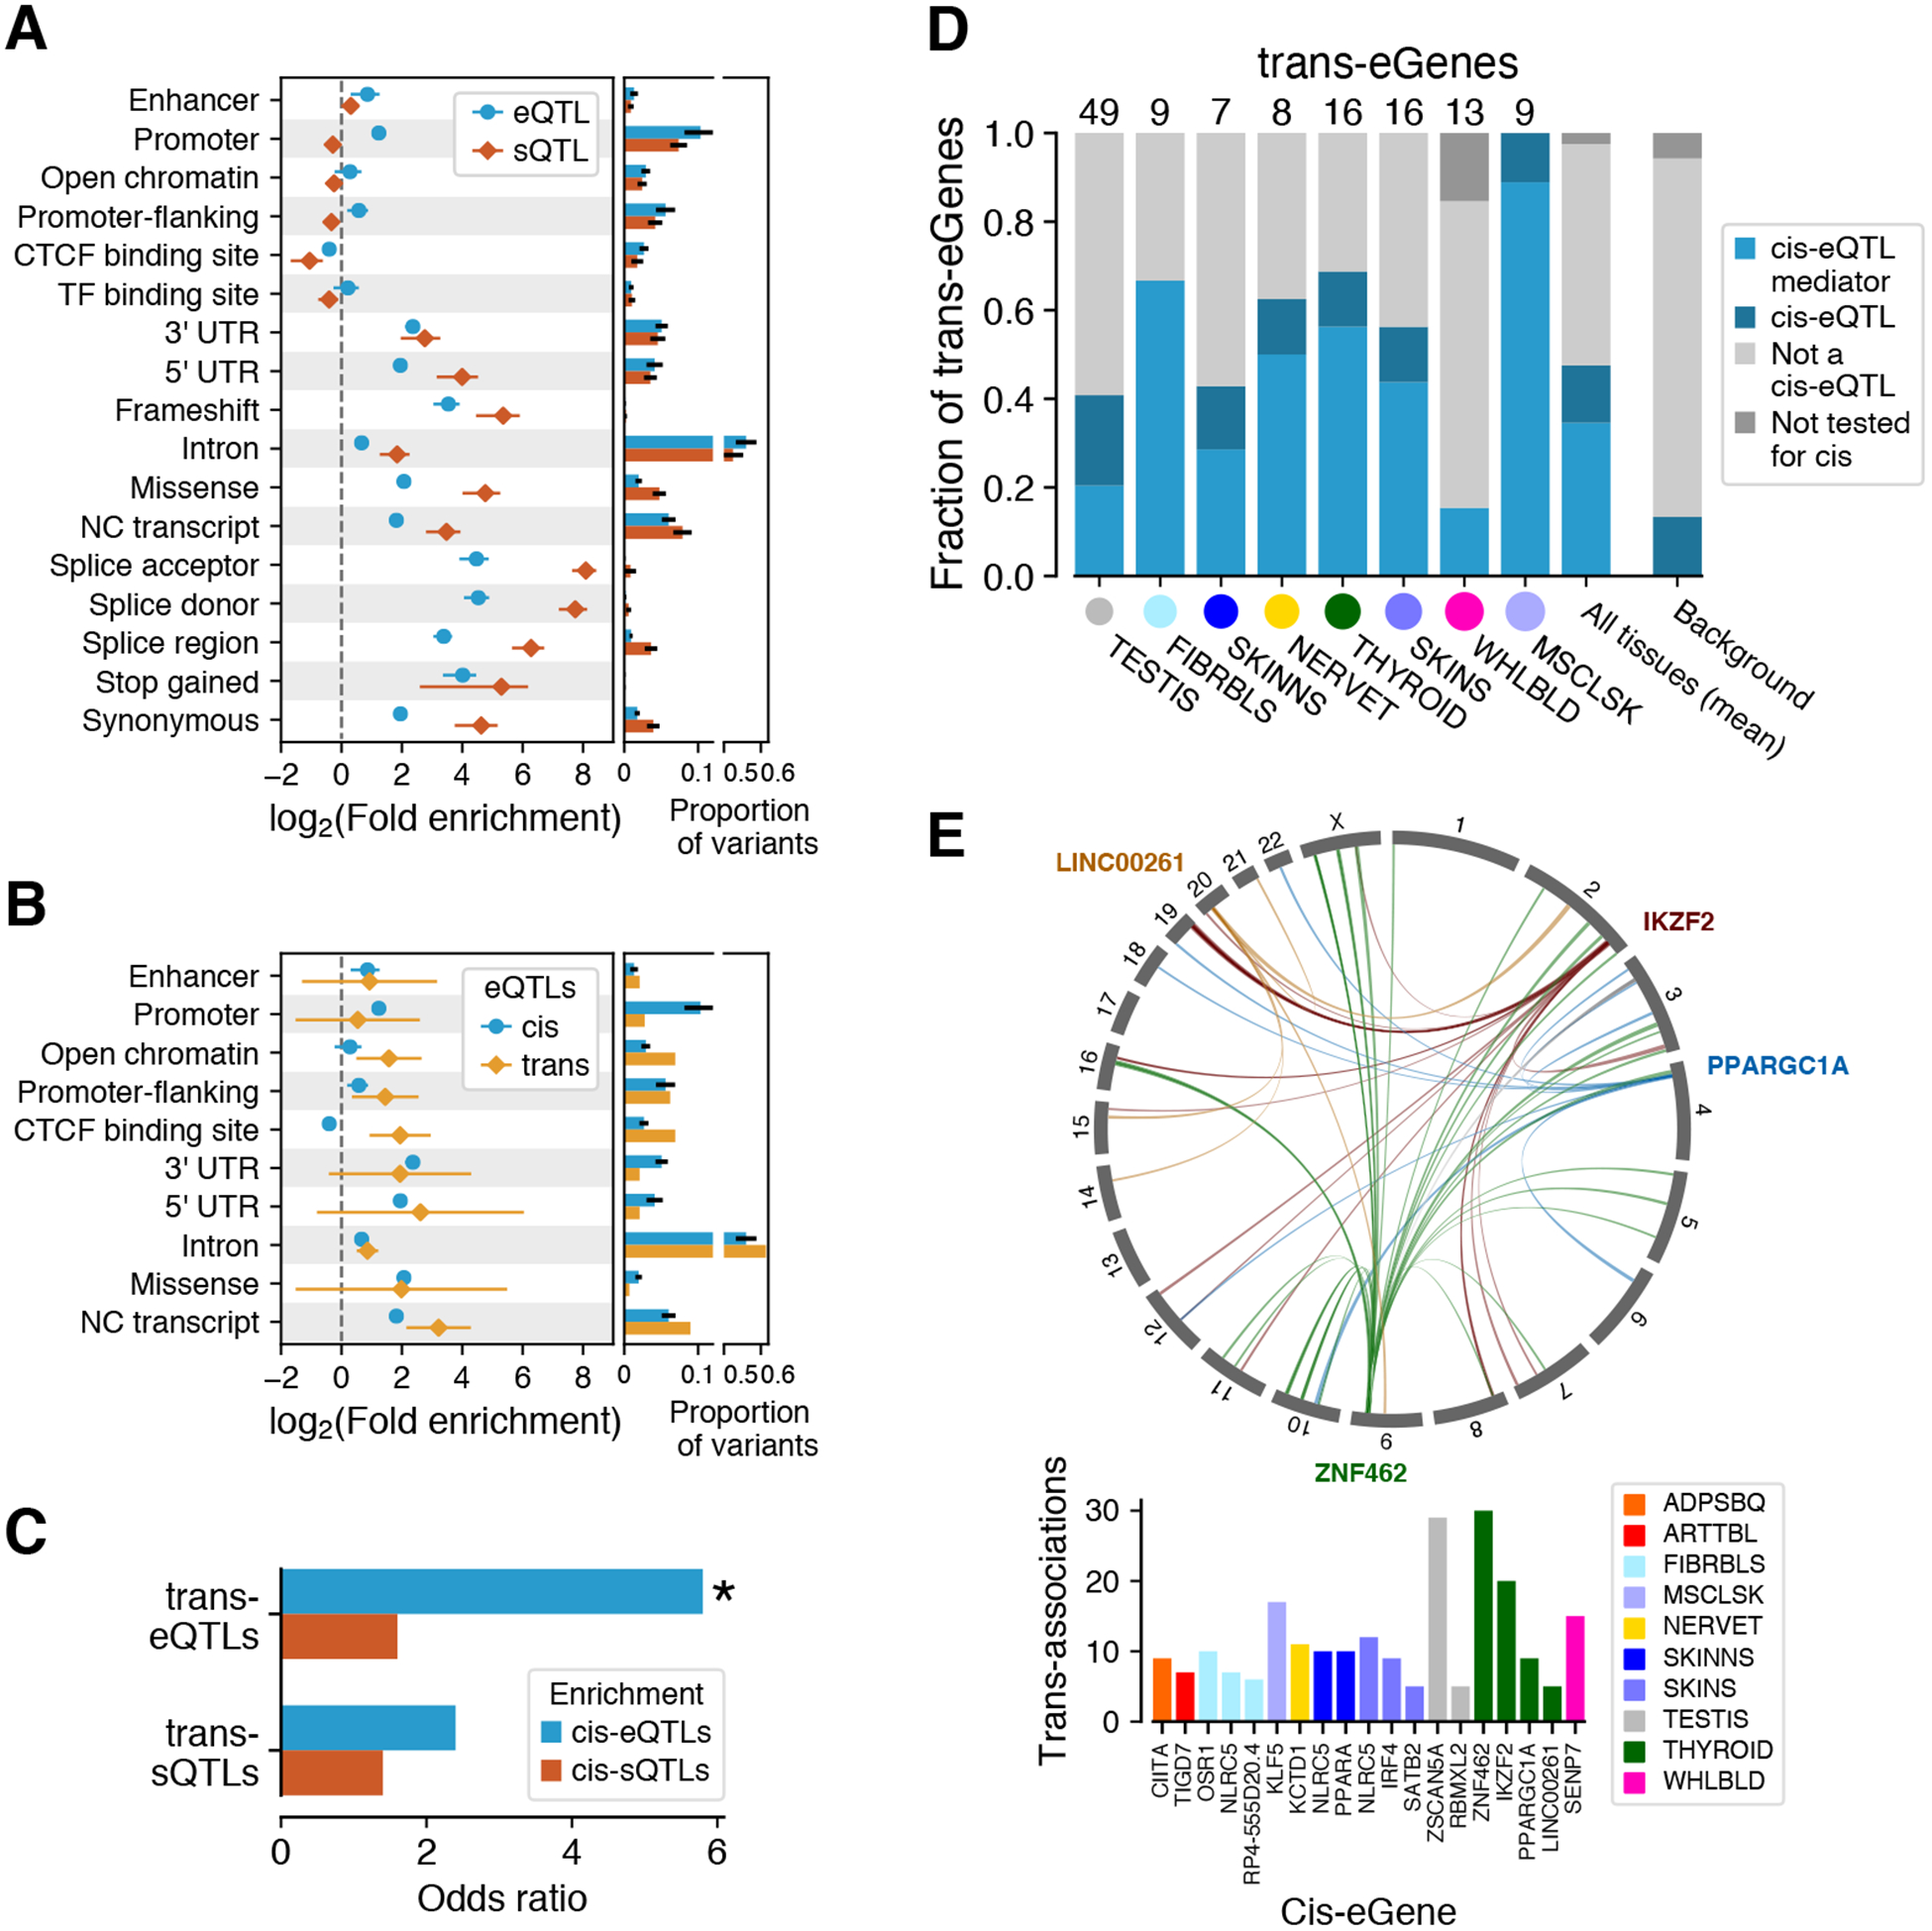
QTL enrichment in functional annotations for (A) cis-eQTLs and cis-sQTLs and for (B) trans-eQTLs. cis-QTL enrichment is shown as mean ± s.d. across tissues; trans-eQTL enrichment as 95% C.I. (C) Enrichment of lead trans-e/sVariants that have been tested for in cis-QTL effects being significant also cis-e/sVariants in the same tissue. * denotes significant enrichment, p < 10−21. (D) Proportion of trans-eQTLs that are significant cis-eQTLs or mediated by cis-eQTLs. (E) Trans associations of cis-mediating genes identified through colocalization (PP4 > 0.8 and nominal association with discovery trans-eVariant p < 10−5). Top: associations for four Thyroid cis-eQTLs (indicated by gene names); bottom: cis-mediating genes with ≥5 colocalizing trans-eQTLs.