
Figure 6. Tissue-specificity of cis-QTLs.
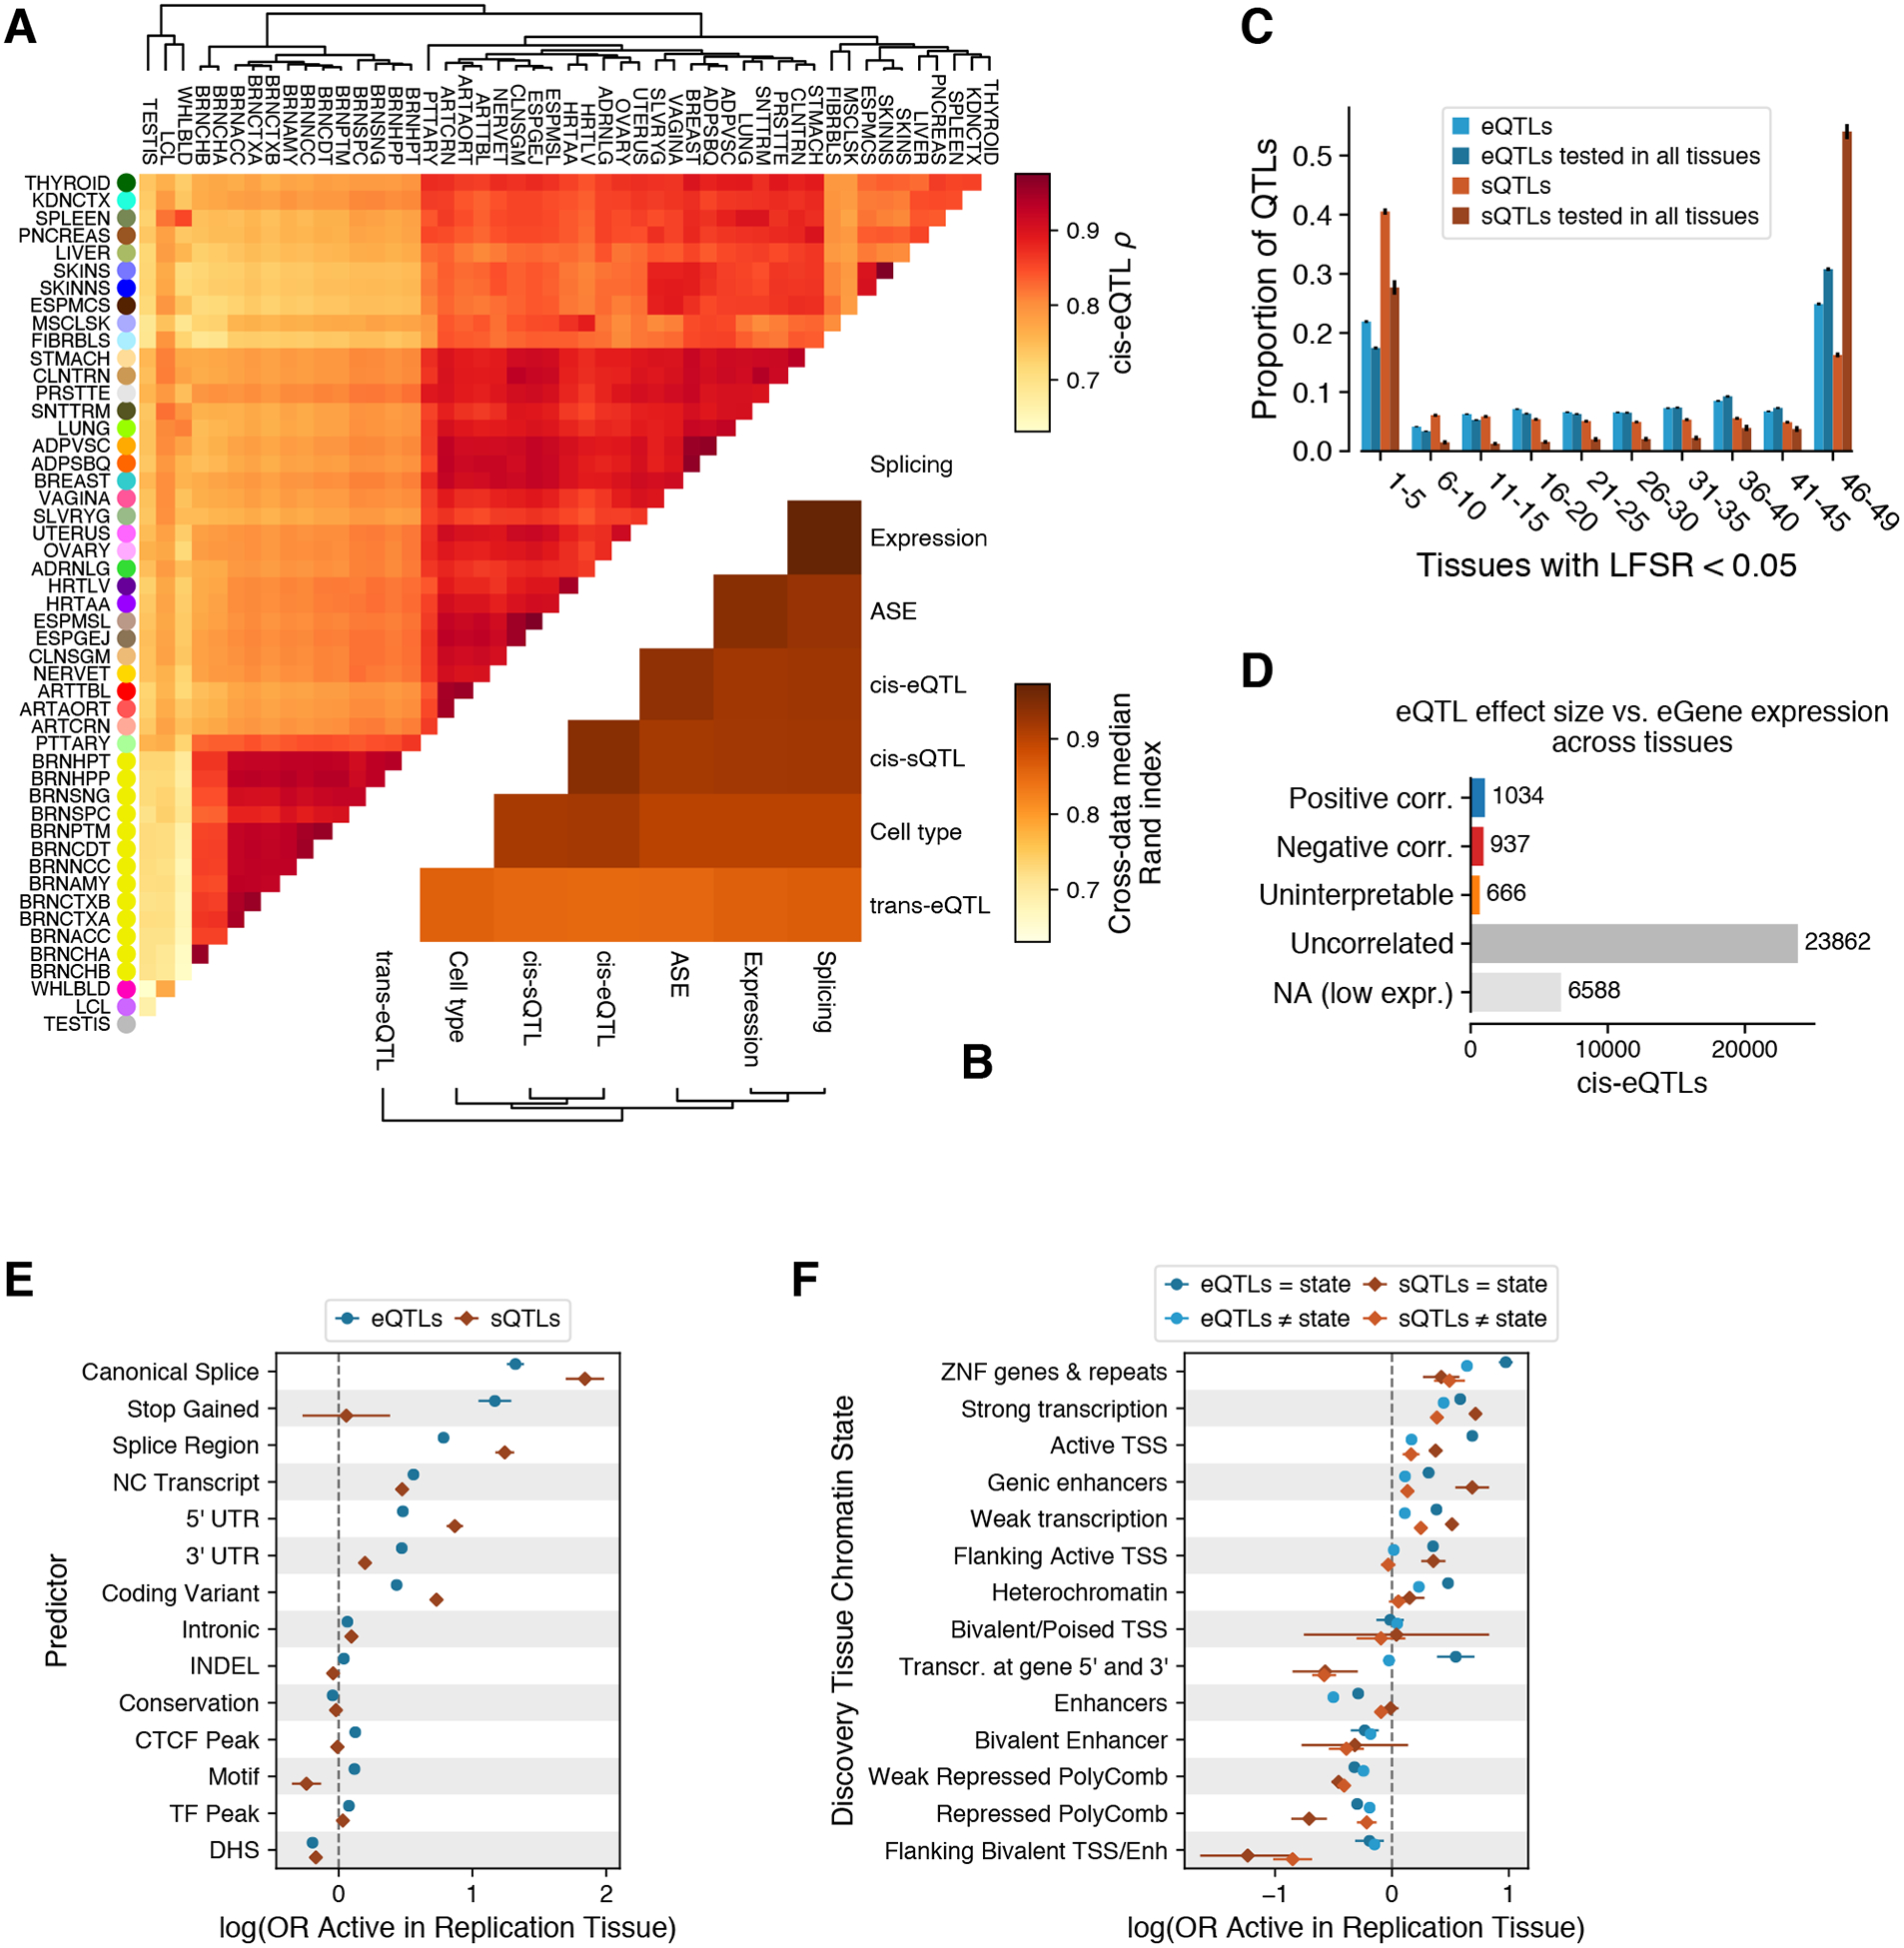
(A) Tissue clustering with pairwise Spearman correlation of cis-eQTL effect sizes. (B) Similarity of tissue clustering across core data types quantified using median pairwise Rand index calculated across tissues. (C) Tissue activity of cis expression and splicing QTLs, where an eQTL was considered active in a tissue if it had a mashr local false sign rate (LFSR, equivalent to FDR) of < 5%. This is shown for all cis-QTLs and only those that could be tested in all 49 tissues (red and blue). (D) Spearman correlation (corr.) between cis-eQTL effect size and eGene expression level across tissues. cis-eQTL counts are shown for those not tested due to low expression level, tested but without significant (FDR < 5%) correlation (uncorrelated), a significant correlation but effect sizes crossed zero which made the correlation direction unclear (uninterpretable), positively correlated, and negatively correlated. (E-F) The effect of genomic function on cis-QTL tissue sharing modeled using logistic regression with functional annotations (E) and chromatin state (F). CTCF Peak, Motif, TF Peak, and DHS indicate if the cis-QTL lies in a region annotated as having one of these features in any of the Ensembl Regulatory Build tissues. For chromatin states, model coefficients are shown for the discovery and replication tissues that have the same or different chromatin states.