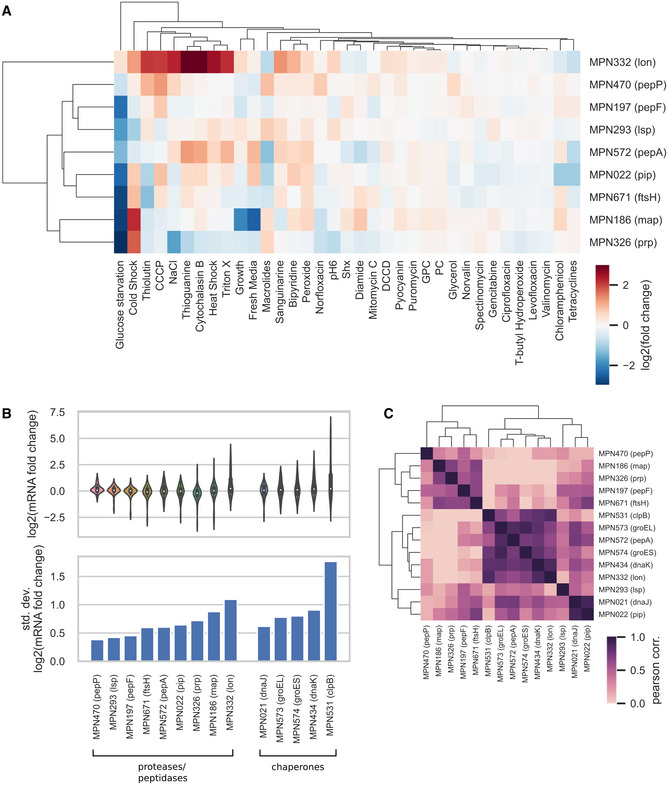
Analysis of transcriptional changes of proteases, peptidases, and chaperones across a set of 35 environmental and genetic perturbations taken from Yus
et al (
2019). (A) Fold changes in mRNA levels for proteases and peptidases. Genes and perturbations were clustered based on the similarity of their transcriptional change pattern. (B) Distribution (upper plot) and standard deviation (lower plot) of the log
2 of mRNA fold changes for proteases, peptidases, and chaperones. (C) Pearson correlation coefficient of mRNA fold changes between pairs of genes in the chaperones, proteases, and peptidases functional groups. Genes were clustered based on the similarity of their correlation pattern.

