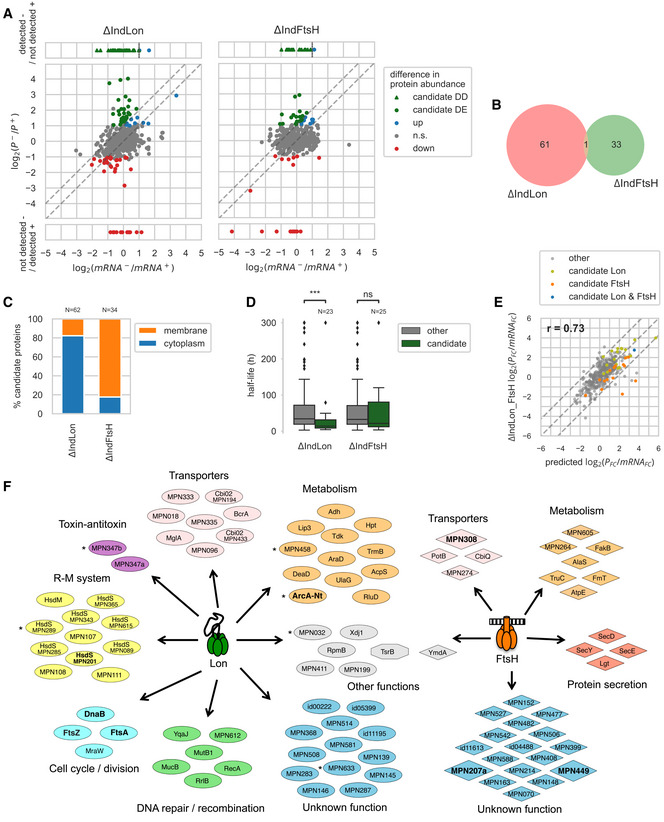
Transcriptional and protein abundance changes between inducing (+) and depleting (−) conditions (48 and 72 h of depletion for Lon and FtsH, respectively) in ΔIndLon and ΔIndFtsH mutant strains. Differentially expressed (DE) Lon/FtsH candidate substrates were identified as proteins with a significant increase in abundance upon protease depletion that could not be attributed to an increase in mRNA levels, i.e. log2(protein_FC/mRNA_FC) ≥ 1 (upper dashed line). Differentially detected (DD) candidates were identified as proteins not detected in the induced condition and detected in the depleted condition, and whose mRNA level did not increase more than 2‐fold (vertical dashed line).
Overlap of substrate candidates between the two mutant strains.
Proportion of membrane and cytoplasmic proteins among candidate substrates.
Distribution of half‐lives measured by a SILAC time course experiment (average from 2 to 4 biological replicates) for Lon/FtsH candidate substrates as compared to the other proteins. Lon candidate substrates showed significantly shorter half‐lives (MWW two‐sided test, ***P = 6.53 × 10⁻⁴). Box shows the quartiles of the distribution, line shows the median, whiskers extend to 1.5 times the inter‐quartile range past the low and high quartiles and define the limits for outliers, shown as points.
Changes in the protein to mRNA fold changes ratio, log2(protein_FC/mRNA_FC), in the double mutant strain ΔIndLon_FtsH as compared to the predicted ratio, computed as the sum of the log2 ratios of both individual mutants. Proteins that showed a significant change in protein level in at least one of the individual mutants are shown (374 proteins). Proteins whose ratio deviated significantly from the predicted one (upper and lower dashed diagonal lines) reveal epistasis effects.
Functional classification of candidate substrates. Validated substrates are highlighted in bold. Asterisks indicate candidate substrates classified as pseudogenes or truncated gene variants.

