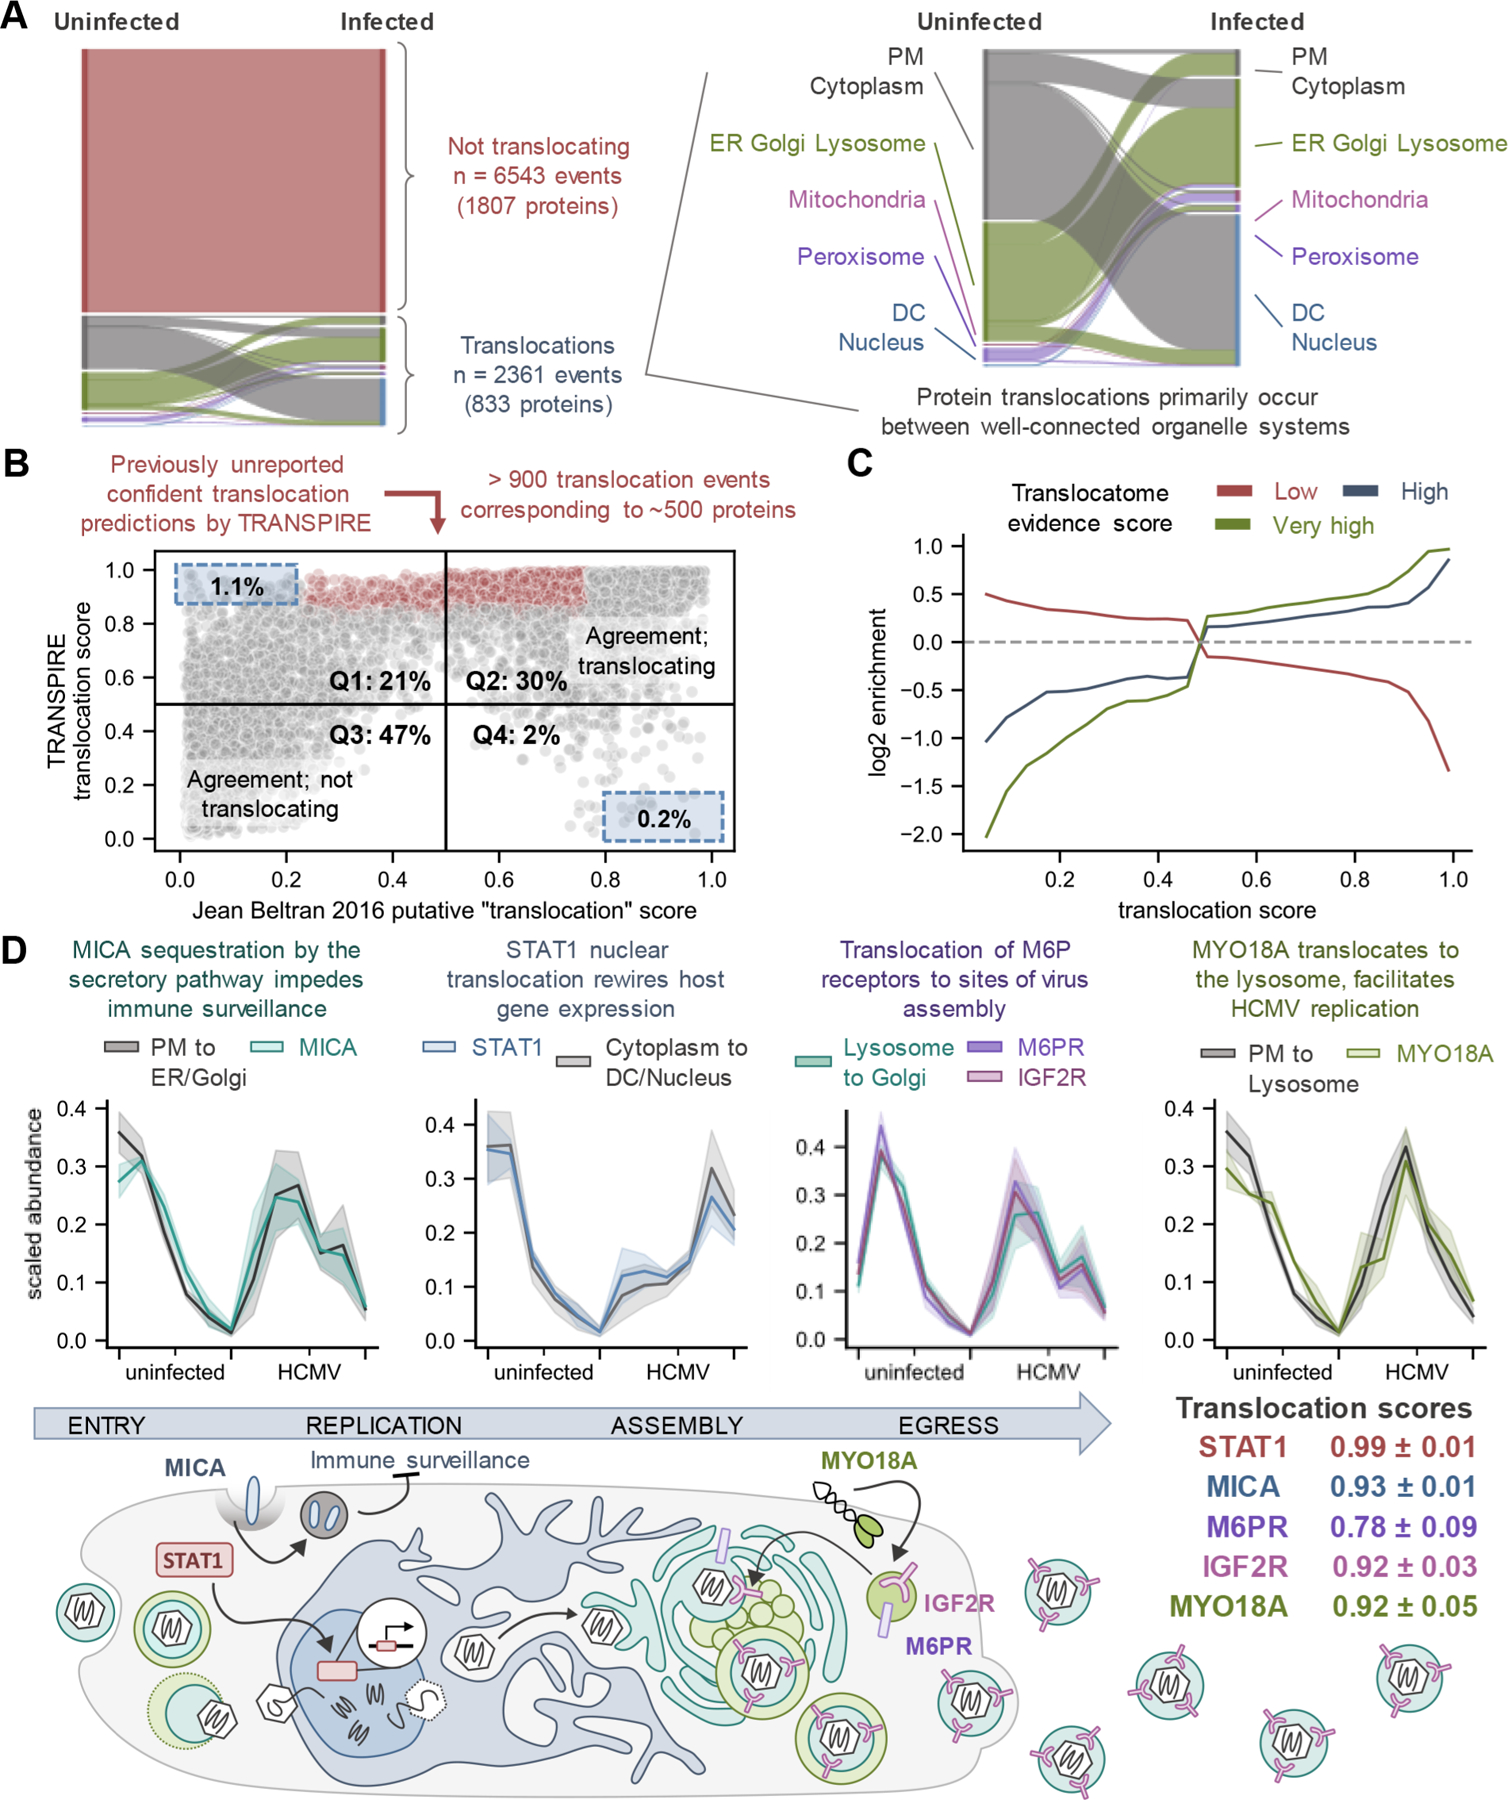
Figure 3.

HCMV infection globally induces protein movements. (A) Sankey diagram depicting all high confidence predictions made by TRANSPIRE across all infection conditions. Each color (besides red) represents a different organelle, while the width of the strip represents the number of proteins that correspond to that organelle in each state. (B) Agreement between TRANSPIRE translocation predictions and the original study. To make this comparison, we generated a putative “translocation score” from the organelle assignments described in the original study (see eqs 5 and 6). Scores closer to 0 or closer to 1 indicate less uncertainty, while scores closer to 0.5 represent high uncertainty. (C) Translocation scores plotted against the relative enrichment for proteins with low, high, and very high translocation evidence scores in the Translocatome database.91 Cutoffs were defined as per the Translocatome publication (e.g., low ≤ 0.4487, high > 0.4487 ≤ 0.6167, and very high > 0.6167), and the enrichment baseline was determined by the translocation evidence scores for all proteins detected in the study. D) TRANSPIRE identification of proteins known to translocate upon HCMV infection. (Top) Protein translocation profiles compared to synthetic translocation profiles for the corresponding predicted translocation class. Solid lines and shaded areas represent the mean and standard deviation, respectively, of protein profiles across all time points for uninfected and infected cells. (Bottom) schematic overview of the role of these movements during HCMV infection. Mean translocation scores and their standard deviations across time points are reported. Abbreviations: PM, plasma membrane; DC, dense cytosol.
