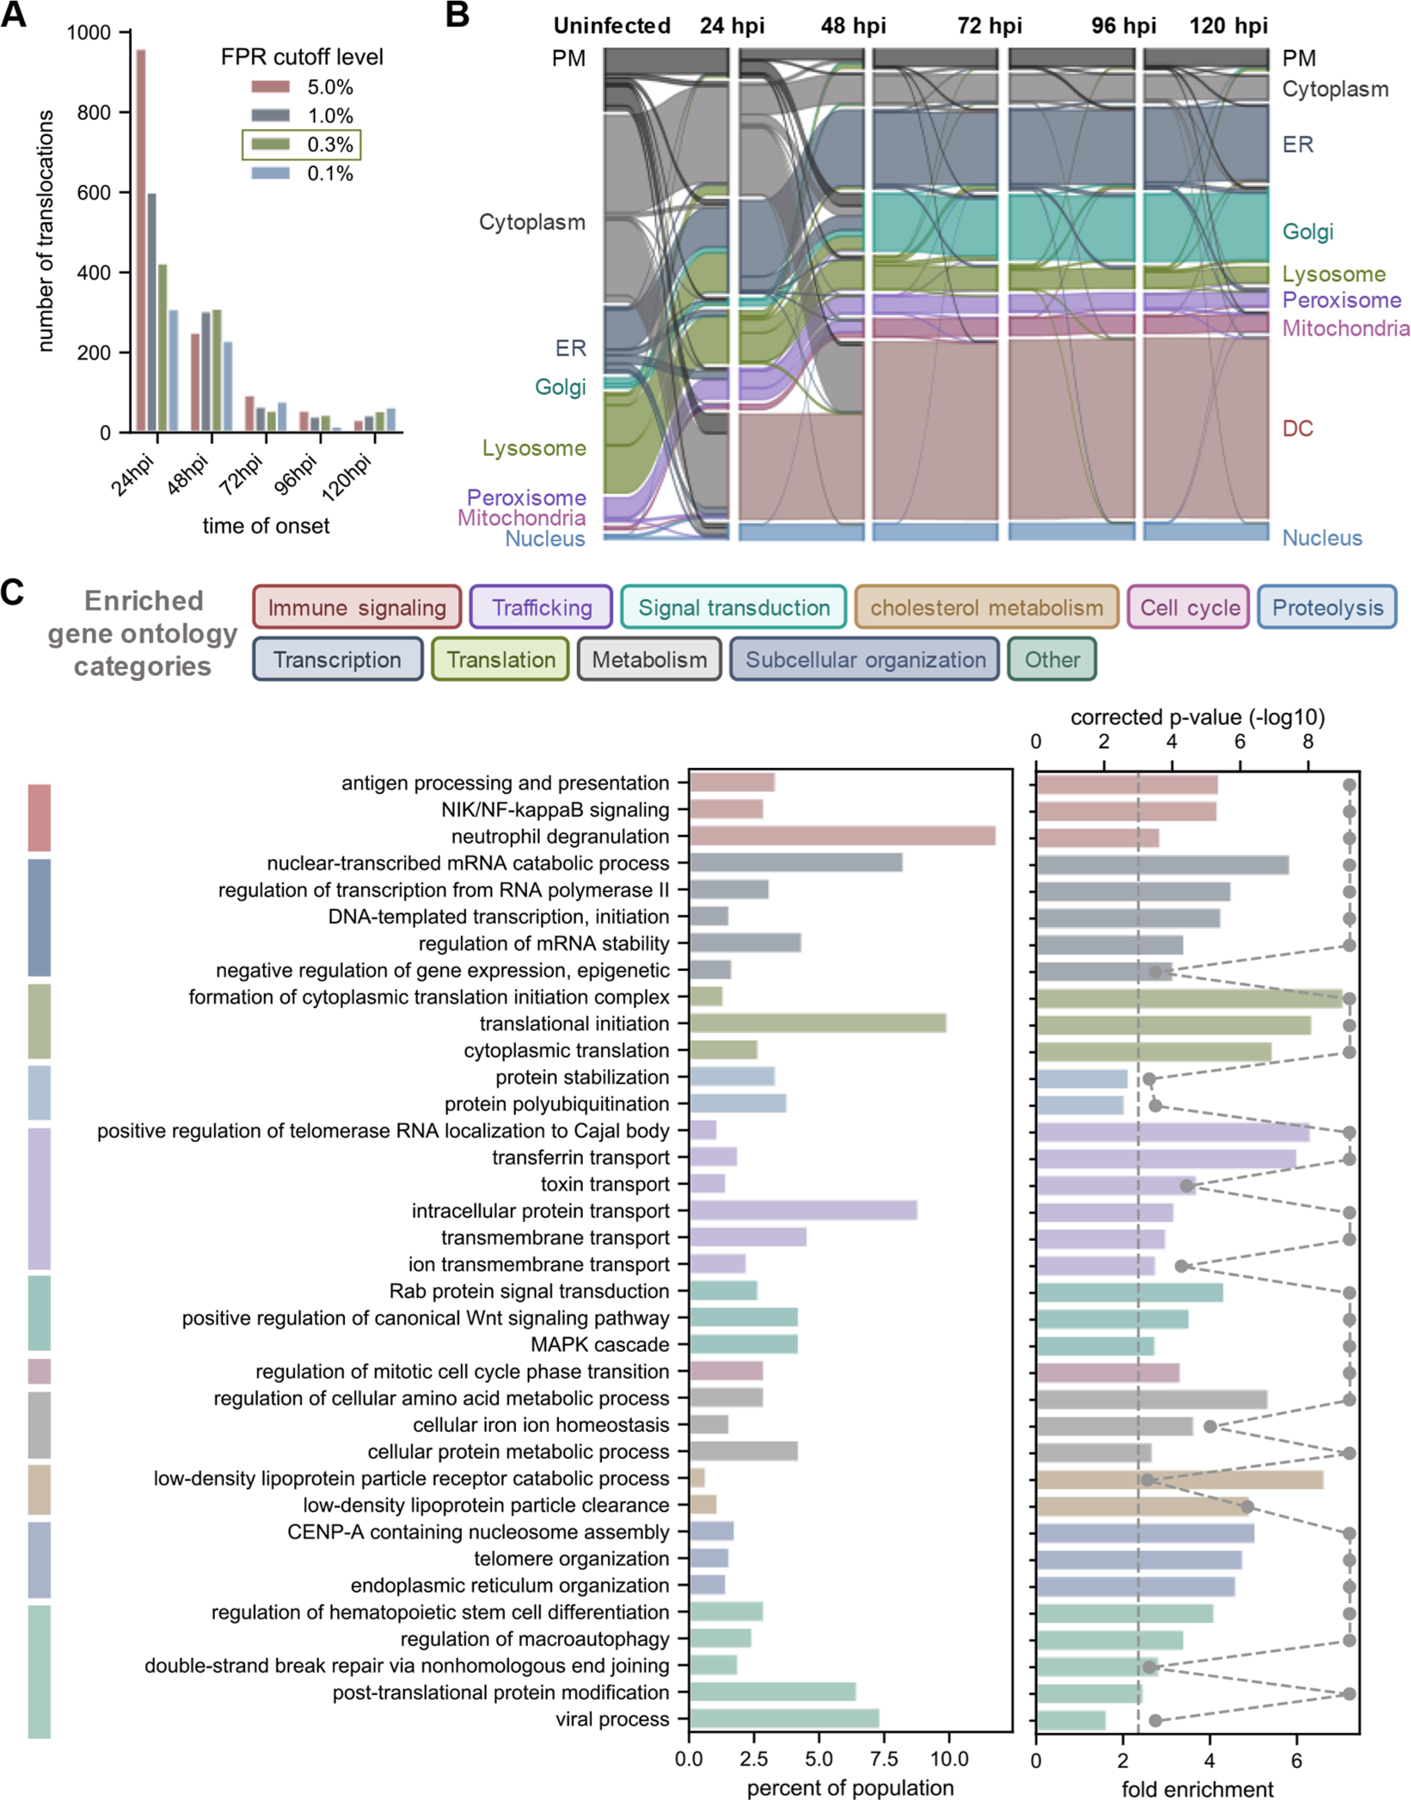
Figure 4.

Temporal, spatial, and functional nature of protein movements reflect the HCMV modulation of cellular pathways. (A) Onset times for protein movement events identified by TRANSPIRE. Onset was defined as the first time point with a translocation score above the determined cutoff. (B) Spatiotemporal dynamics of protein movements during HCMV infection illustrated as a Sankey diagram. (C) Results of gene ontology (GO) analysis of all translocating proteins. GO terms are color-coded by the general category that they belong to. Gray data points on the right-most graph represent the −log10(p-value), and the dashed line represents a significance cutoff of 0.05. GO terms that returned a p-value of 0.0 based on FDR resampling are represented with a p-value of 0.0001 for visualization purposes. PM, plasma membrane; DC, dense cytosol.
