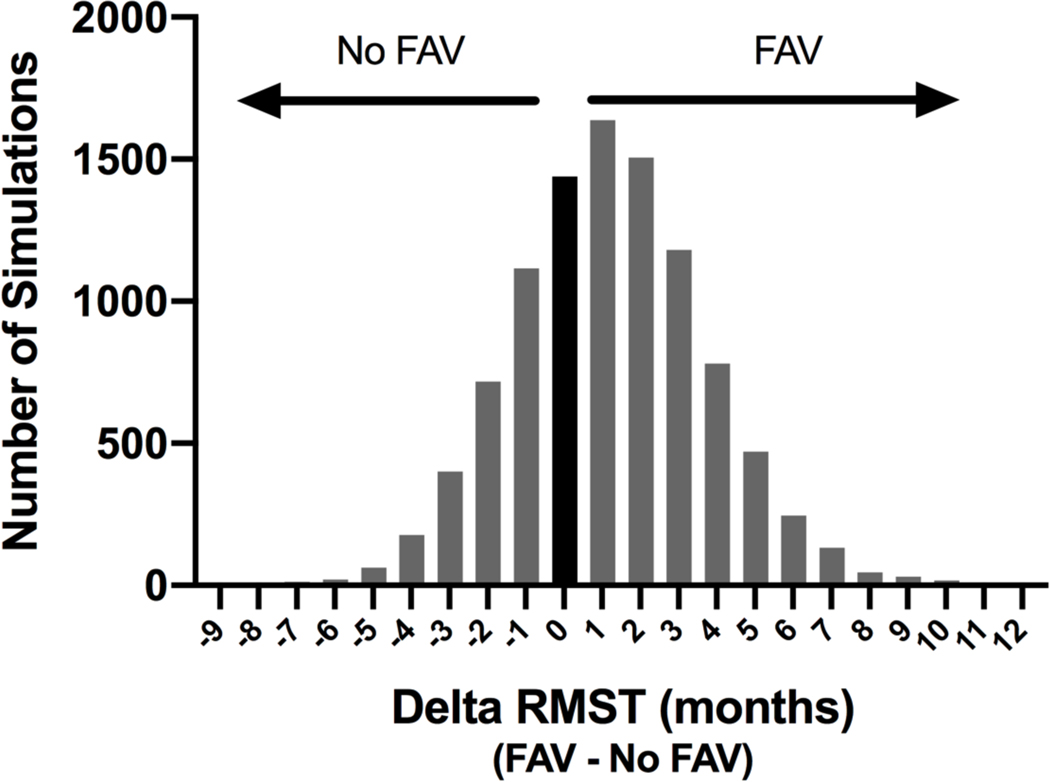
Figure 4. Frequency Histogram of Difference in Restricted Mean Transplant-free Survival Time (RMST) for Fetal Aortic Valvuloplasty (FAV) versus Expectant Management.
The delta RMST value (months) to age 6 years for each of the 10,000 simulations (FAV – No FAV) was plotted as a frequency distribution. The Y axis is the number of simulations with that delta RMST value. A value of 0 indicates the two strategies had equal expected RMST and is represented by the black bar. A positive value indicates FAV had a greater expected RMST (preferred strategy) and a negative value indicates expectant management (No FAV) had a greater expected RMST.

