
Figure 1.
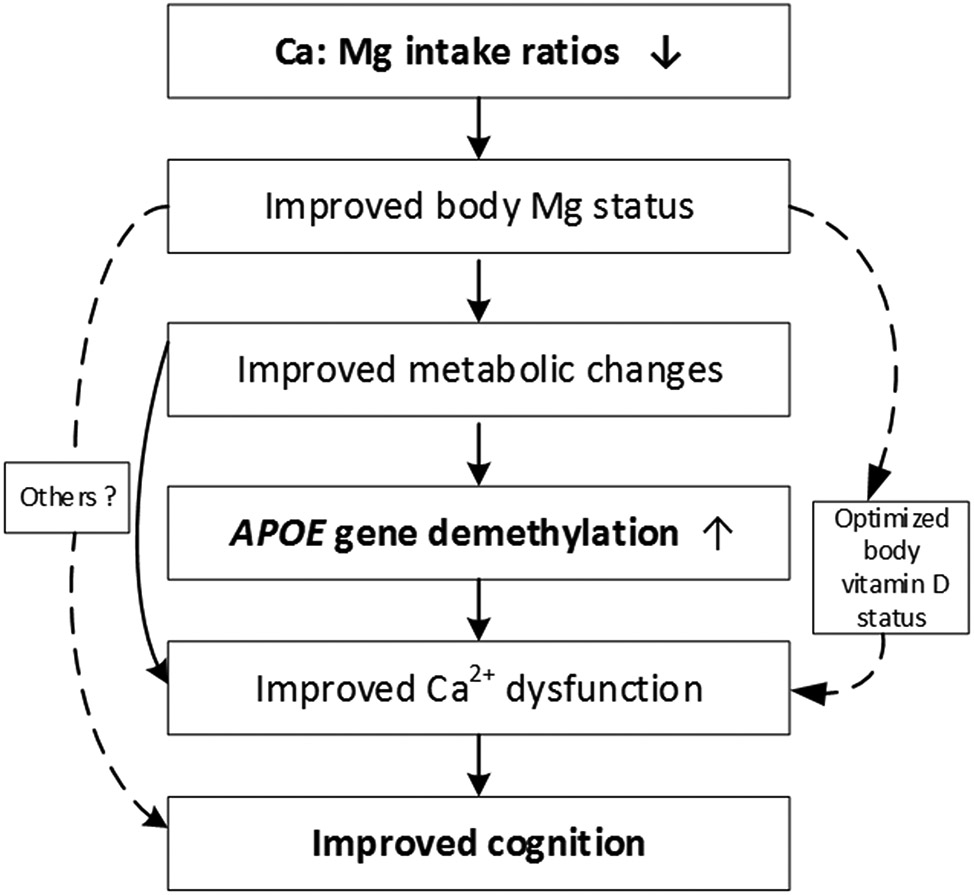
Directed Acyclic Graph To Illustrate Potential Causal Pathways
(Bolded are the focuses to be tested in the current study)
Official websites use .gov
A
.gov website belongs to an official
government organization in the United States.
Secure .gov websites use HTTPS
A lock (
) or https:// means you've safely
connected to the .gov website. Share sensitive
information only on official, secure websites.
Directed Acyclic Graph To Illustrate Potential Causal Pathways
(Bolded are the focuses to be tested in the current study)