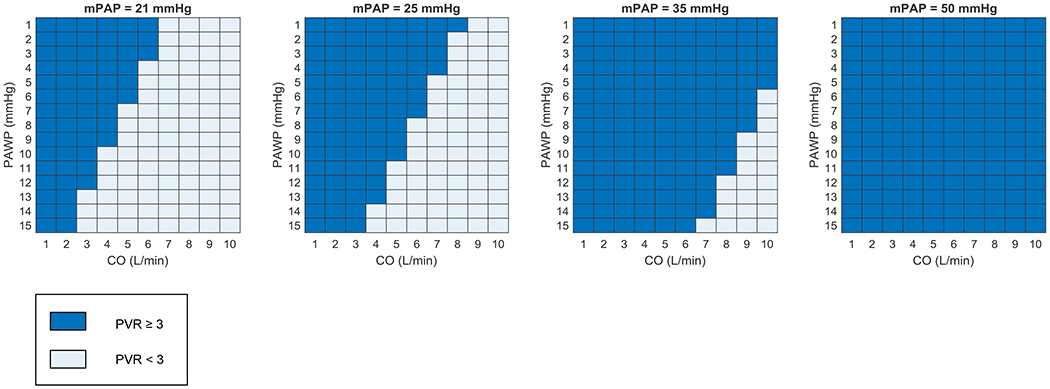
Figure 2. Effect of different mean pulmonary artery pressure thresholds on the proportion of cardiac output and pulmonary artery wedge pressure combinations leading to an elevated pulmonary vascular resistance.

Combinations of cardiac output (CO) and pulmonary artery wedge pressure (PAWP) resulting in a pulmonary vascular resistance (PVR) ≥3 Woods units (WU) are displayed in dark blue and those resulting in a PVR <3 WU are displayed in light blue.
