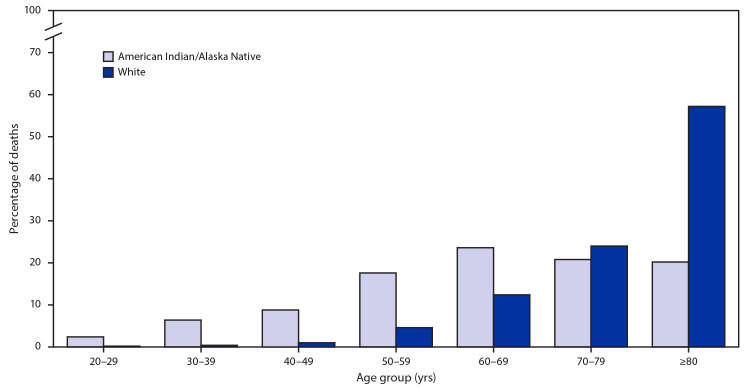
FIGURE.
Percentage distribution of COVID-19–associated deaths among American Indian/Alaska Native* and non-Hispanic White persons aged ≥20 years, by age group† — 14 states,§ January 1–June 30, 2020
Abbreviation: COVID-19 = coronavirus disease 2019.
* Includes Hispanic and non-Hispanic ethnicities.
† Percentages by age group are not age-adjusted.
§ Alaska, Arizona, Louisiana, Minnesota, Mississippi, Nebraska, New Mexico, New York, North Dakota, Oklahoma, Oregon, South Dakota, Utah, and Washington.

