Figure 1.
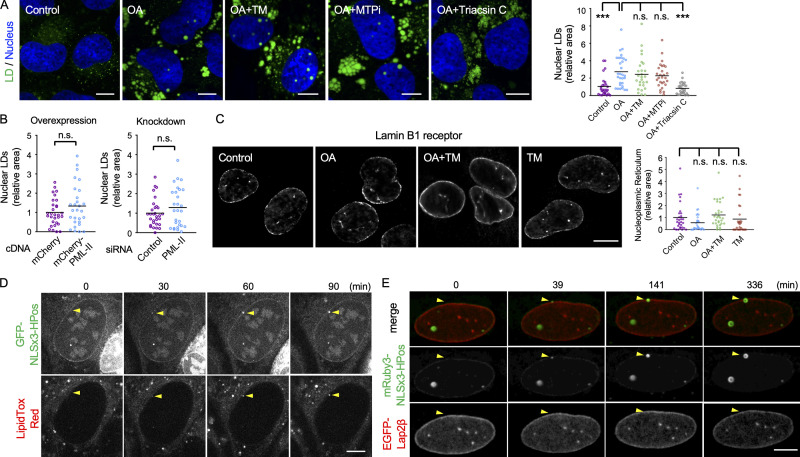
Nuclear LDs in U2OS. (A) Nuclear LDs in U2OS treated for 1 d with none (control), 0.4 mM OA (OA), OA and 5 µg/ml tunicamycin (OA+TM), OA and 100 nM BAY13-9952 (OA+MTPi), or OA and 5 µM triacsin C (OA+Triacsin C). LDs, green; nucleus, blue. The area of total nuclear LDs per nucleus was quantified. The number of nuclei counted: 28 (control), 30 (OA), 27 (OA+TM), 28 (OA+MTPi), 29 (OA+Triacsin C). Pooled data from three independent experiments. Kruskal–Wallis ANOVA test followed by Dunn’s test; ***, P < 0.001. (B) The effect of PML-II overexpression and knockdown. U2OS transfected with PML-II cDNA or PML-II siRNA cultured with OA for 1 d. The number of nuclei counted: 30 (control cDNA), 28 (PML-II cDNA), 30 (control siRNA), 28 (PML-II siRNA). Pooled data from three independent experiments. Mann–Whitney test. (C) The NR immunolabeled for lamin B1 receptor. U2OS were cultured for 1 d with none (control), 0.4 mM OA (OA), OA and 5 µg/ml tunicamycin (OA+TM), or 5 µg/ml tunicamycin (TM). The area of intranuclear labels per nucleus was quantified. The number of nuclei counted: 30 (control, OA, and OA+TM), 27 (TM). Pooled data from three independent experiments. Kruskal–Wallis ANOVA test followed by Dunn’s test. (D and E) Nuclear LD formation in U2OS treated with OA for 1 d. (D) GFP-NLSx3-HPoS, nuclear LDs; LipidTox Red, general LDs. Selected frames from Video 1 are shown. Arrowheads indicate a nuclear LD forming in the nuclear periphery. (E) mRuby3-NLSx3-HPos, nuclear LD; EGFP-Lap2β, INM. Selected frames from Video 2 are shown. Arrowheads indicate a nuclear LD forming in the nuclear envelope. Scale bars, 10 µm. n.s., not significant.

