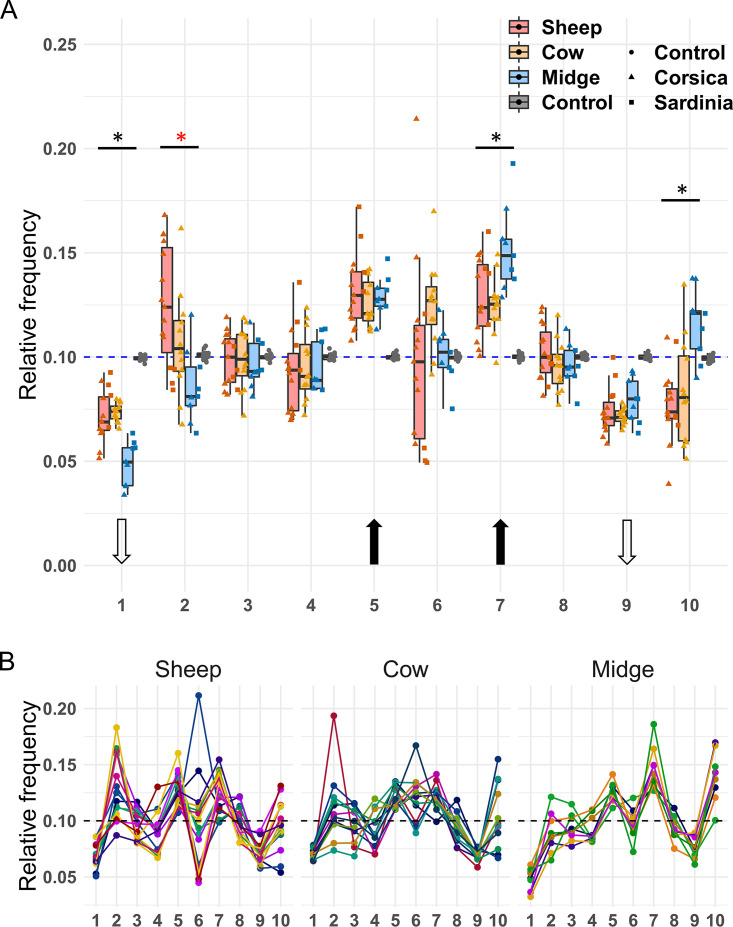
FIG 2.
(A) Relative frequencies of BTV segments in naturally infected sheep, cows, and biting midges. The number of each segment is shown below the graph. The blue dashed line indicates the expected frequency under segment equimolarity. The results obtained with the plasmid control (“Control,” boxplots in gray) are shown to allow comparison with a template with equimolar amounts of PCR targets. Dot shape indicates sample origin (island) or template type (plasmid control versus field samples). The black and white arrows indicate the segments for which the average relative frequency was significantly higher or lower, respectively, than expected under equimolarity. Significant differences in frequencies among hosts for a given segment are indicated with a star above boxplots. Black asterisks correspond to significant differences between populations in the two ruminant hosts versus those in midges, whereas the red asterisk shows a significant difference between BTV populations from sheep and biting midges. (B) Segment frequencies per sample. Dots represent the relative frequency of a given segment (x axis) in a sample. Samples have been split per host in three panels (sheep, cow, and midge). For each host, all dots from a given sample are linked by a line of the same color.

