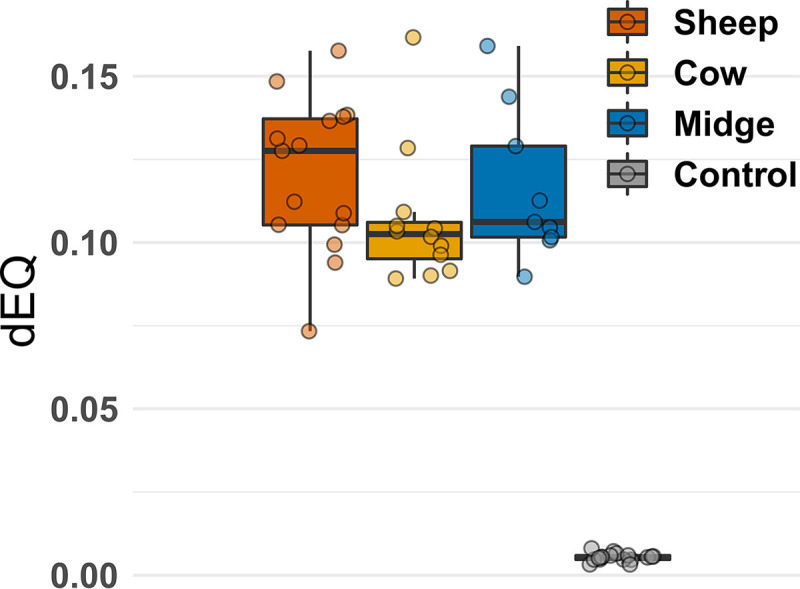
FIG 3.

Distributions of segment frequencies per sample and host. Each dot indicates the distance to equimolarity of segment frequencies in a given sample (dEQ; see Materials and Methods for the formula). dEQ estimates obtained with the control plasmid (boxplot in gray) are provided to allow comparison with samples bearing equimolar amounts of PCR targets.
