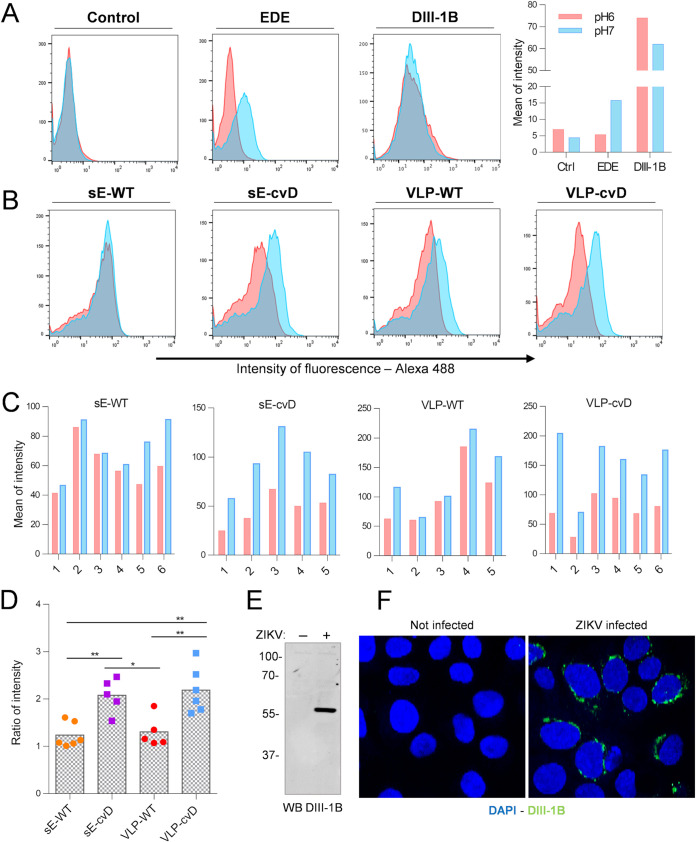
FIG 3.
Determination of binding characteristics of serum IgGs to different sE conformations. (A) Cells expressing sE on the cell surface were incubated with pooled control sera (control), monoclonal EDE antibody 1C10 (EDE), or monoclonal DIII-1B antibody (DIII-1B) at pH 6.0 (red) or pH 7.0 (blue). Following washing, the bound antibodies were detected using a fluorescence-tagged secondary antibody, and the relative fluorescence was determined by flow cytometry using FACSCalibur. Mean of fluorescence intensity was calculated using FlowJo software and plotted (right). (B and C) Sera from immunized animals were incubated with cells as described for panel A. (B) Histogram plots show data from one serum sample as representative of each immunized group. (C) Bar charts showing data for sera from individual animals from each immunized group plotted as means of fluorescence intensity. (D) Ratios between the intensity of fluorescence at different pHs were calculated; gray columns represent means. Statistical analysis was performed using one-way ANOVA, 95% confidence level, with Tukey’s multiple comparison (GraphPad software). Data are representative of three independent experiments, performed with pooled and single serum samples. Characterization of the mouse monoclonal antibody (MAb) DIII-1B. MAb DIII-1B was obtained using standard hybridoma technology from BALB/c mice immunized with recombinant domain III of ZIKV E protein. (E) The specificity of MAb DIII-1B was tested by Western immunoblotting of VERO cells that were mock-infected (−) or infected with ZIKV (+). As expected, MAb DIII-1B specifically bound to ZIKV E protein. Protein molecular weight ladder is shown on the left (in kDa). (F) Separately, the binding specificity of MAb DIII-1B was also tested by indirect immunofluorescence of uninfected or ZIKV-infected A549-NPro cells. Green signal indicates antibody binding to ZIKV E protein. Cell nuclei were stained with 4′,6-diamidino-2-phenylindole (DAPI) (blue).

