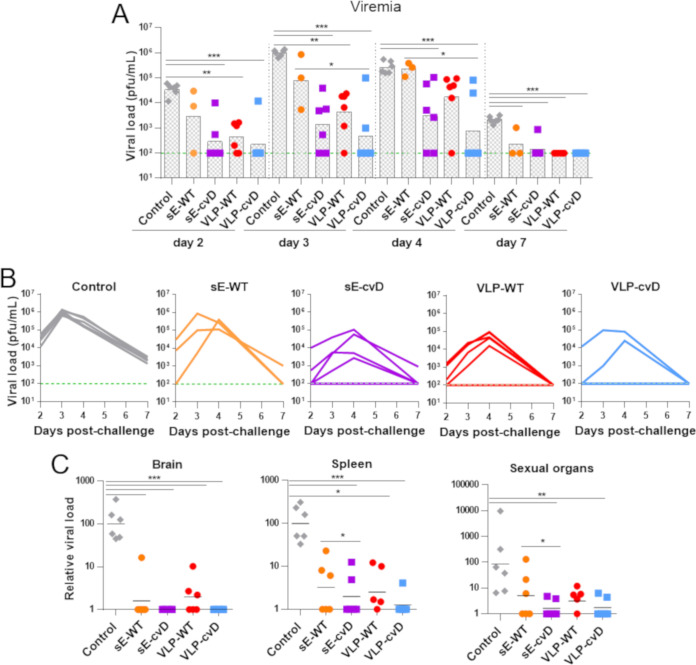
FIG 6.
Viral titer in challenged animals. (A) The levels of ZIKV in the serum at day 2, 3, 4, and 7 postinfection were quantified by RT-qPCR and the results plotted as PFU per milliliter. (B) The limit of detection was estimated to be 100 PFU/ml, indicated by the green line. Columns show means from all mice. (C) Relative viral loads in brain, spleen, and sexual organs: the presence of viral RNA in tissues was quantified by RT-qPCR, and the results are plotted as relative viral load calculated using the average from the PBS control group. Statistical significance is reported. Statistical analysis was performed using two-sided ANOVA, 95% confidence level, with Tukey’s pairwise comparison at 95% confidence with Minitab software.

