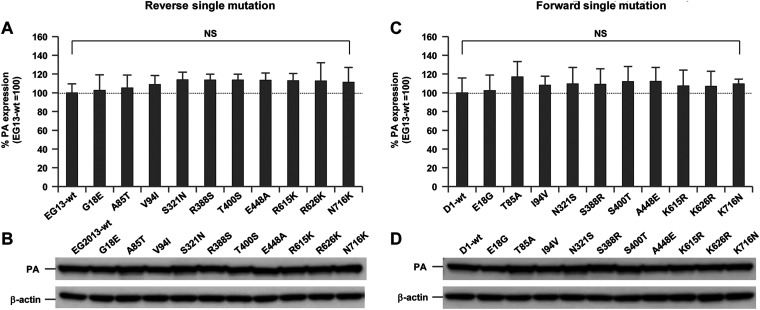
FIG 4.
Quantification of PA expression. 293T cells were transfected with PA expression plasmids carrying the indicated mutations, and cell lysates were analyzed by Western blotting using anti-PA antibody. (A and C) After quantification of the band intensity, the amount of PA produced by each mutant was expressed relative to that for wild-type PA. (A) Expression of contemporary EG13-PA, each carrying a reverse PA mutation. (C) Expression of ancestral D1-PA, each carrying a forward PA mutation. Each data point is the mean ± SD from five independent experiments. NS indicates no statistically significant difference. (B and D) Representative images of the Western blots of each EG13-PA with a reverse mutation (B) and each D1-PA with a forward mutation (D).

