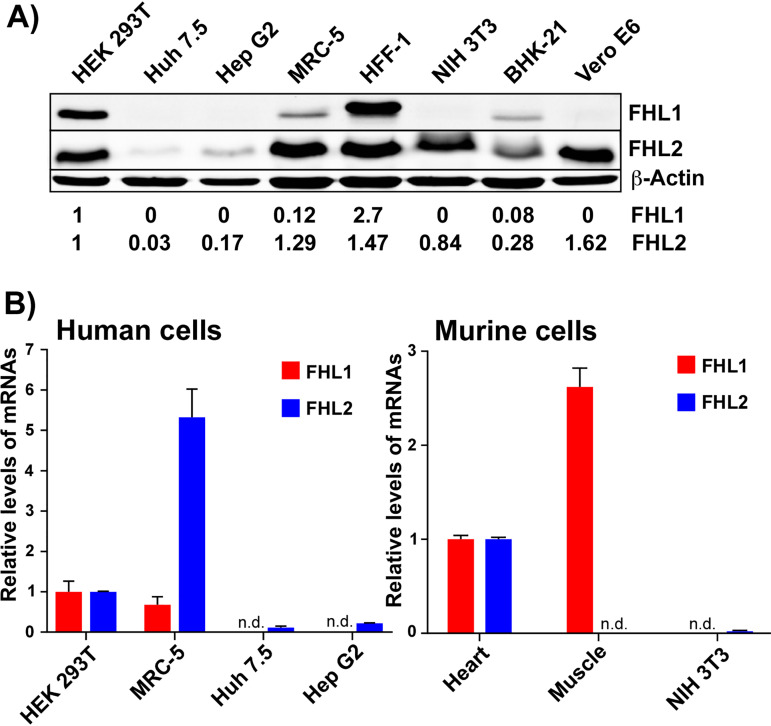
FIG 1.
Vertebrate cell lines strongly differ in the levels of FHL1 and FHL2 expression. (A) Lysates of different cell lines were analyzed by WB for the expression of FHL1 and FHL2 proteins using specific Abs. The membranes were scanned on a LI-COR imager. Relative levels of proteins were determined using the manufacturer’s software. The data were normalized to the levels of β-actin and the levels of FHL1 and FHL2 proteins in HEK 293T cells. (B) Concentration of FHL1- and FHL2-specific mRNAs in the indicated cells. The data were normalized to the levels of 18S rRNA in each sample. For human and mouse cells, the data were also normalized to concentrations of the mRNAs in HEK 293T and mouse heart muscle, respectively. n.d., nondetectable.

