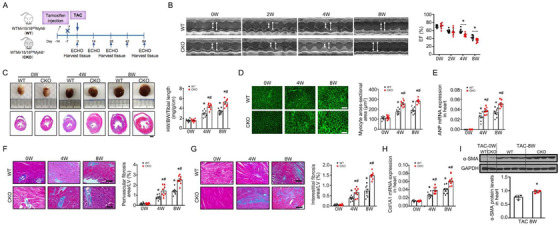
FIGURE 2.

Cardiomyocyte‐specific mir15a/mir16‐1 knockout aggravates cardiac hypertrophy and dysfunction after TAC. A, Cardiomyocyte‐specific mir15a/mir16‐1 knockout (CKO) and wild‐type (WT) control mice were subjected to tamoxifen, followed by TAC operation for 8 weeks. B, M‐mode echocardiographic imaging of the heart before (0) and after (2, 4, and 8 weeks) TAC. Analysis of and ejection fraction (EF)% of hearts of WT and CKO mice subjected to TAC (n = 8 per group). *P < .05 versus WT mice. C, Whole‐mount representation of heart (Upper), representative image of heart sections stained with Masson trichrome (bottom), heart weight/body weight/tibia length ratios in WT and CKO mice before and after (4 and 8 weeks) TAC (n = 8 per group). *P < .05 versus mice before TAC; # P < .05 versus WT‐TAC. Bars = 500 μm. D‐H, WGA‐stained section of left ventricles and quantification of myocyte cross‐sectional area (D), ANP mRNA expression (1.5‐fold at 4 weeks, 1.5‐fold at 8 weeks) (E), representative image of perivascular (F) and interestitital fibrosis (G) and quantification of fibrotic area, Col1A1mRNA expression (1.5‐fold at 4 weeks, 1.5‐fold at 8 weeks) (H) in WT and CKO mice before and after (4 and 8 weeks) TAC (n = 8 per group). *P < .05 versus mice before TAC; # P < .05 versus WT‐TAC. D, Bars = 50 μm; F and G, Bars = 100 μm.
I, α‐SMA protein levels (1.3‐fold) in heart from WT and CKO mice before and post‐TAC 8 weeks (n = 4 per group). *P < .05 versus WT‐TAC. Statistical significance was determined by the two‐sided t‐test (B‐H) or Mann–Whitney U test (I)
