
FIGURE 3.
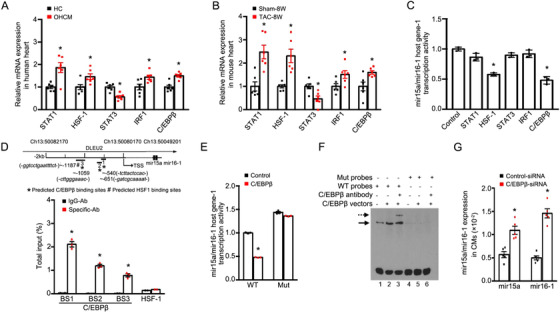
Downregulation of mir15a/mir16‐1 cluster in cardiomyocytes by C/EBPβ. A, qRT‐PCR indicated the expression of STAT1 (1.9‐fold), HSF1 (1.5‐fold), STAT3 (0.6‐fold), IRF1(1.4‐fold), and C/EBPβ (1.5‐fold) in human samples from representative normal control and hypertrophic hearts (n = 6 per group). *P < .05 versus HC. B, qRT‐PCR indicated the expression of STAT1 (2.5‐fold), HSF1 (2.3‐fold), STAT3 (0.5‐fold), IRF1(1.4‐fold), and C/EBPβ (1.6‐fold) in hearts from mice subjected to TAC (n = 6 per group). *P < .05 versus sham operation. C, Quantification of luciferase activity in cells with human pri‐mir15a/mir16‐1‐luciferase reporter constructs followed by TF overexpression as indicated (n = 3 experiments with 5 well replicates). *P < .05 versus control vector. D, Putative C/EBPβ or HSF1 binding sites are shown as asterisks or pound signs. Consensus sequences are italicized in parentheses. PCR amplicons 1, 2, and 3 are shown as numbered lines. Chromatin immunoprecipitation assays were performed using IgG, C/EBPβ, or HSF1 antibody (Ab) in cells stimulated with PE (n = 3 experiments). *P < .05 versus IgG Ab. E, Quantification of luciferase activity in cells transfected with wild‐type construct of pri‐mir15a/mir16‐1 or its mutant at the C/EBPβ‐binding site. Luciferase values normalized to the empty vector control (n = 3 experiments with 3 well replicates). *P < .05 versus control vector. F, EMSA assay showed specific binding complexes with 293T cells transfected with C/EBPβ expression vectors (lane 2). A weak signal was observed in non‐transfected 293T cells (lane1). Supershift experiments indicated C/EBPβ‐binding specificity (lane 3). Arrows indicate specific C/EBPβ‐DNA complexes (straight line) or antibody‐ C/EBPβ–DNA supershift complexes (dashed line). When the putative CEBP binding site was mutated, no DNA/protein complex was observed (lanes 4‐6). Bottom signals correspond to free probes. G, mir15a and mir16‐1 expression in CMs transfected with control‐siRNA or C/EBPβ‐siRNA subjected to PE (n = 5 per group). *P < .05 versus Control‐siRNA. Statistical significance was determined by the two‐sided t‐test (A, B, D, and G), by 1‐way ANOVA Tukey's post‐hoc test (C), by Mann‐Whitney test (E)
Abbreviation: TSS, transcription start site.