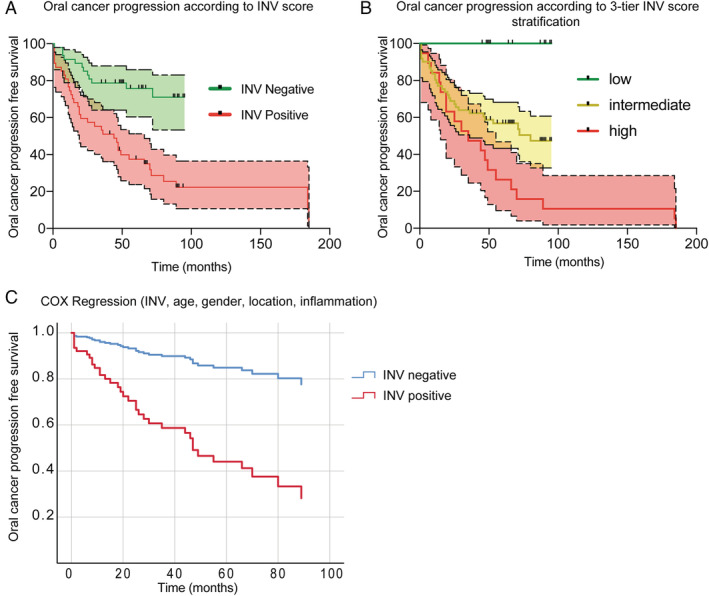
Figure 5.

Kaplan–Meier and Cox regression analysis of oral cancer progression‐free survival according to INV. (A) Progression according to positive INV. Cut off values were defined using the Youden index; censored cases are marked with a vertical black line. Chi square 17.91, p < 0.0001 Mantel–Cox; Chi square 14.56, p < 0.001 Gehan–Breslow–Wilcoxon test. (B) Progression according to positive 3‐tier INV score distribution. Stratification of INV was performed using the SPSS optimal binning tool. Chi square 18.83, p < 0.0001 Mantel–Cox; Chi square 18.79, p < 0.0001 Logrank test for trend; Chi square 13.49, p < 0.0012 Gehan–Breslow–Wilcoxon test. (C) Cox regression analysis of oral cancer progression according to INV score status (positive/negative) HR = 8.485; 95% CI 2.855–25.213, p < 0.0001.
