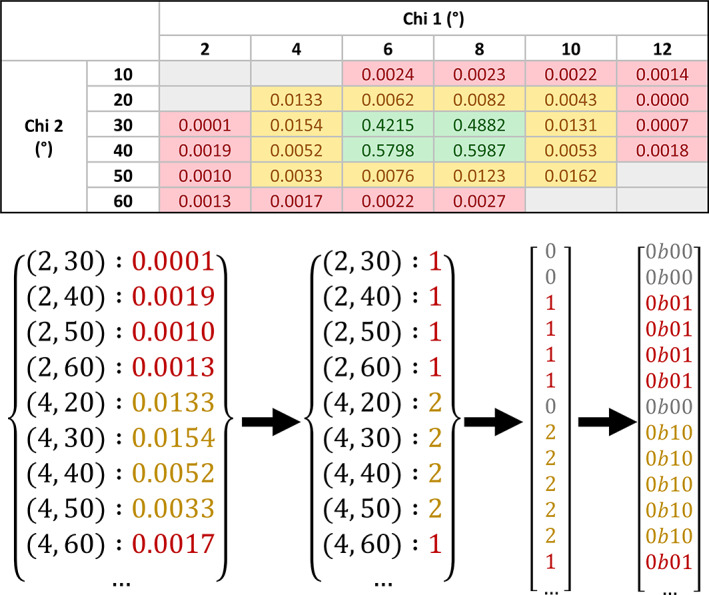
FIGURE 1.

Visualization of the rotamer library compression. The topmost figure shows a contour grid for a hypothetical amino acid with two side‐chain torsion angles. Grid points are colored red for “outlier” values, yellow for “allowed” values, green for “favored” values, and gray for “unknown”—where a coordinate is not listed in the original contour grid file. The bottom figure illustrates the compression process: starting with the conversion from floating point to integer data points, followed by the type conversion from dictionary to integer array, which includes the addition of zeros to represent null data points, and lastly the compression of Python integers to two‐bit binary values. It should be noted that the original contour grid values are given to a much higher precision than is shown here
