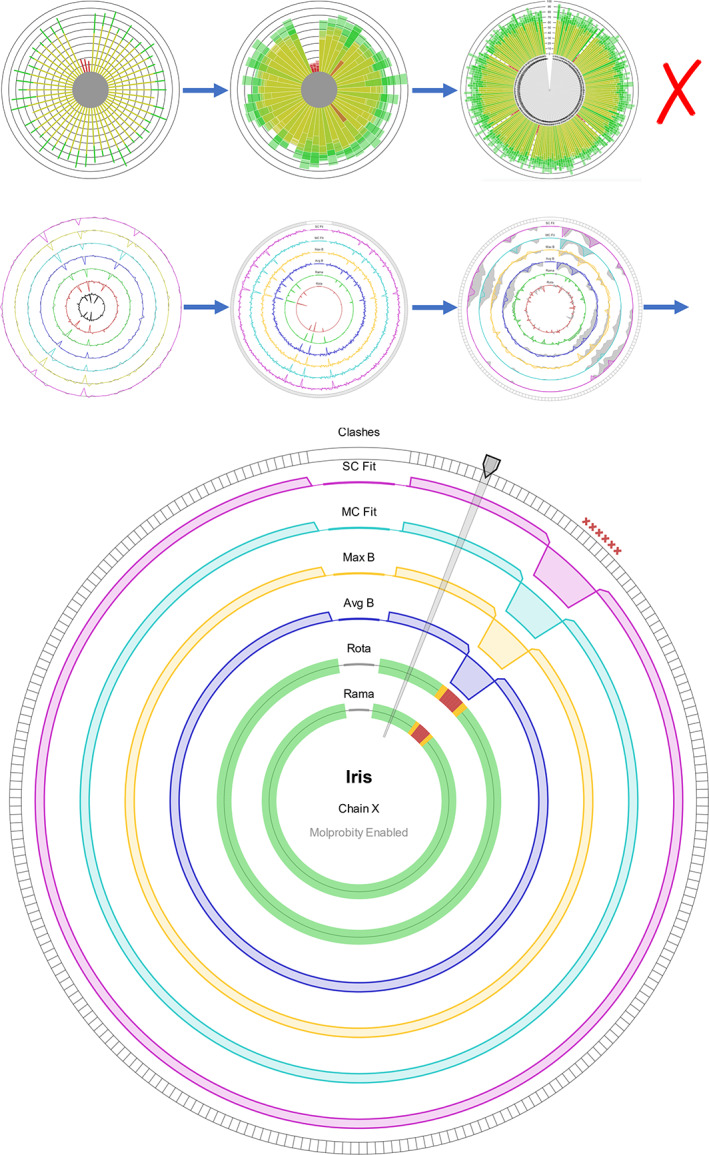
FIGURE 2.

The evolution (top) and final design (bottom) of the Iris chain‐view display. In its first iterations, based on existing residue‐by‐residue displays, the chain‐view was a radial bar chart, with multiple bars stacked on top of one another within a segment. The problem with these initial designs was that in chains with a high number of residues, the chart would become unclear. The third image of the second generation of iterations shows the original “ghosting” implementation. The bottom picture shows an instance of the final design, produced using synthetic data. At the one o'clock position is the residue selector, highlighting an individual residue segment. The patch of 10 residues at the two o'clock position illustrates the indicators of “poor” residues for each feature of the chain‐view graphic. The discrete axes show amber or red segments, the continuous axes show an exaggerated dip toward the center, and MolProbity clash indicators appear around the edge
