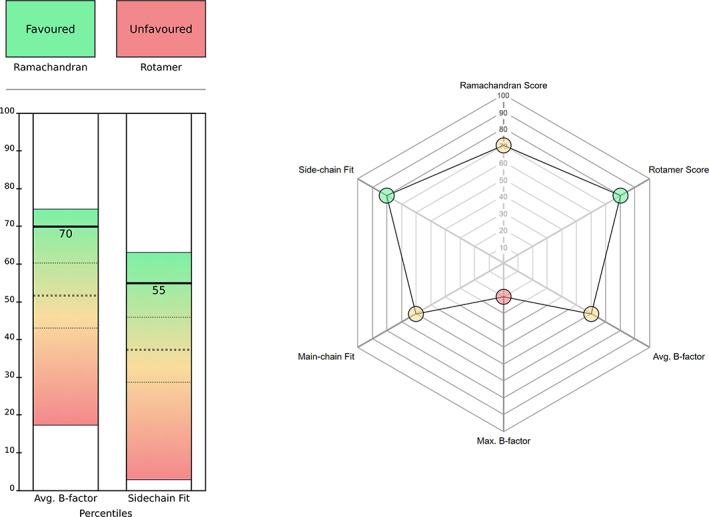
FIGURE 3.

The Iris residue‐view displays: default layout (left) and radar chart (right). In the default layout, the top section contains the discrete metrics, and the bottom section contains the continuous metrics. Of the three dashed lines on each bar, the middle line represents the mean percentile for the selected chain, and the other two lines represent one SD from the mean in each direction. The top and bottom of each bar represent the minimum and maximum percentile for the selected chain. The radar chart option shows all the metrics as continuous scores, on the percentile scale. In this chart, the color of the circle corresponding to each metric represents the position of that particular value within its distribution. Hovering over any of these circles produces a pop‐up bubble containing both the absolute and percentile values for a particular metric. The shape of the chart is updated automatically based on the number of metrics selected
