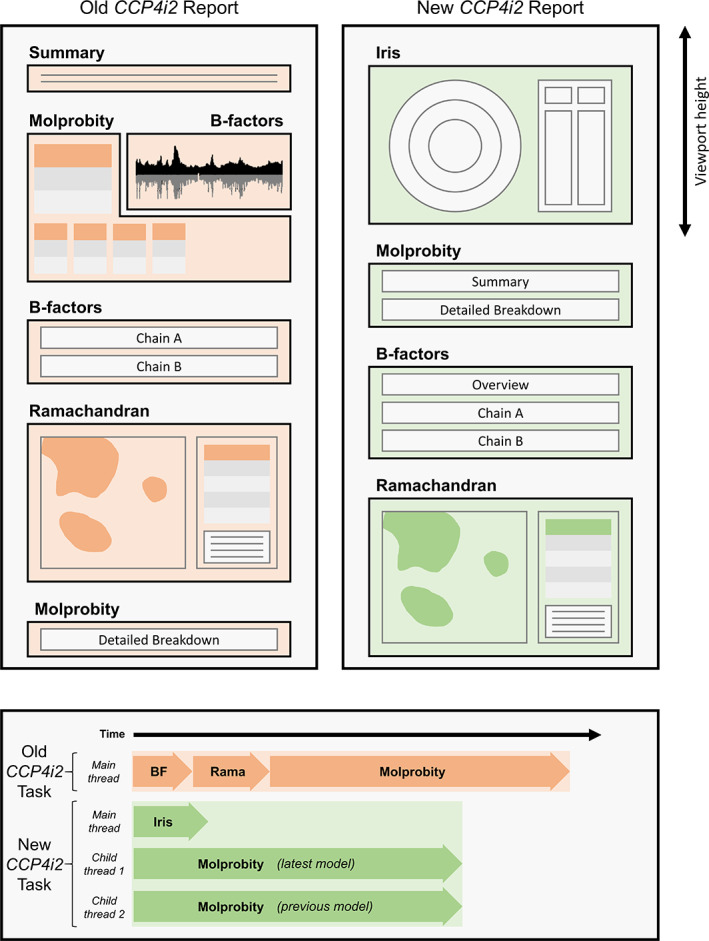
FIGURE 4.

The design (top) and flow (bottom) of the CCP4i2 validation report before and after Iris graphics panel integration with the minimized panel mode. The most noticeable difference to the design is that the Iris graphical panel is now the first view presented to the user when the page is loaded, and fills the viewport to maximize the size of the chain‐view display. The flow of the task has changed more significantly; where the old task performed simple B‐factor and Ramachandran analyses, then executed MolProbity analyses and compiled the results all on the same thread, the new version of the task uses Python's multiprocessing library to run concurrent MolProbity analyses on separate threads while the Iris calculations are performed on the main thread. This significantly reduces the run time, despite doubling the number of analyses being performed. Because the Iris metrics are all calculated within the same cascade, the task only has to perform one set of (slow) Python loops, as opposed to the serial repeats of loops in the original report, hence the newly‐structured report has a shorter run time both with and without MolProbity enabled. Timings are not to exact scale, see results section for accurate timing analysis
