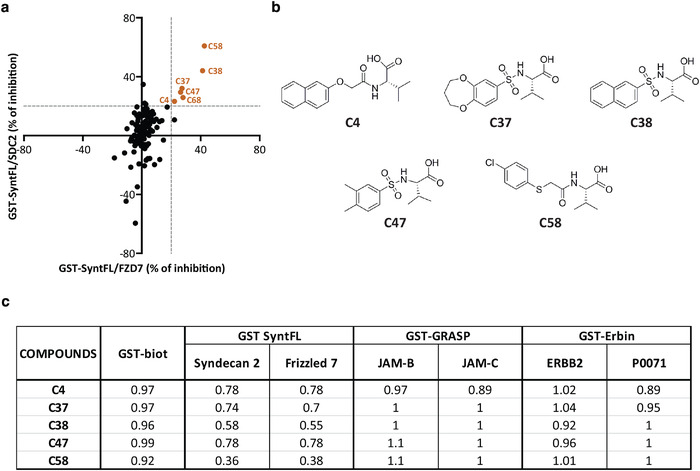
FIGURE 1.

Biochemical assays identify five structurally related active compounds amongst 139 in silico selected potential syntenin PDZ2 inhibitors. (a) Dot plot illustrating the percentage of inhibition of the syntenin‐SDC2 (Y‐axis) and syntenin‐Frizzled 7 (X‐axis) interactions, as determined experimentally by HTRF for the 139 potential inhibitors selected in silico. Compounds that interfere with the FRET signal in a non‐specific manner were previously excluded from the analysis. See table S1, column 'GST‐biot' for more details (b) Chemical structure of the five structurally related compounds (C4, C37, C38, C47 and C58) inhibiting syntenin PDZ interactions. See table S1 for more details. (c) Selectivity of syntenin PDZ inhibitors. Values correspond to the ratio of the signal in the absence of compound (FRET for the interaction) divided by ratio of the signal in the presence of 400µM compound. Compound number (column 1), effect on biotinylated‐GST (column 2), on syntenin‐SDC2 or syntenin‐Frizzled 7 (column 3–4), on GRASP55‐JAM‐B or GRASP55‐JAM‐C (column 5 or 6), and on Erbin‐ERBB2 or Erbin‐P0071 interactions (column 7 or 8). Biotinylated GST (GST‐biot) was used to test for the effects of the compounds on the FRET signal (irrespective of effects on any interaction). Values indicate minor effects (below 10 % difference) validating the approach for each individual compound. HTRF assays on GRASP55 and Erbin PDZ interactions were performed to address the selectivity of the compounds. Note that C58 selectively affects syntenin PDZ interactions, while compound C68 also inhibits GRASP‐JAM‐B interaction
