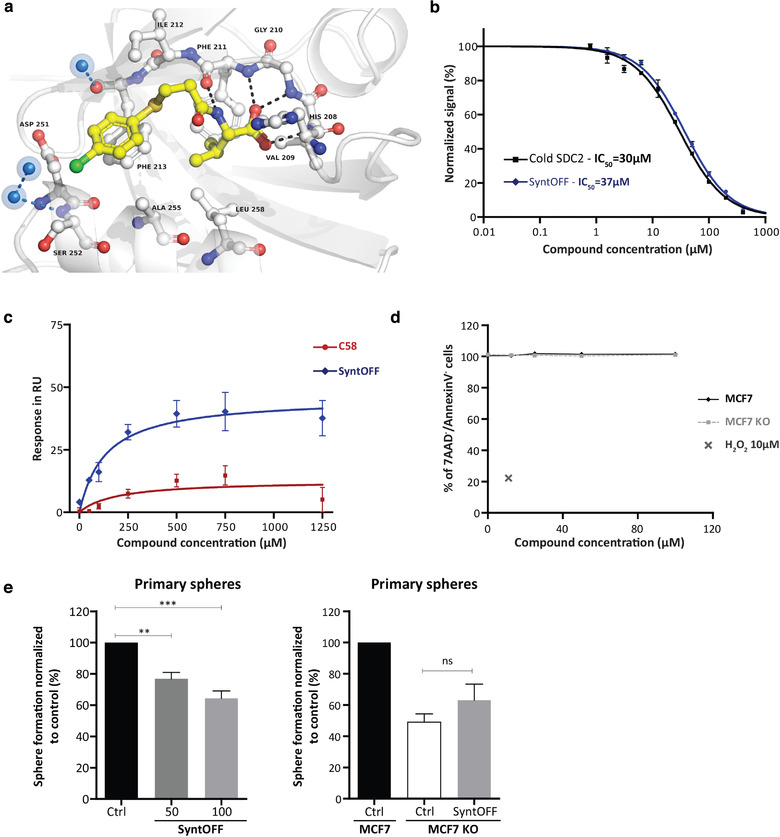
FIGURE 5.

Characterization of SyntOFF biological activity and interaction with syntenin. (a) Details of the interaction of compound SyntOFF with the PDZ tandem of syntenin as determined by crystallographic approach (PDBID: 6RLC). Structures are represented as ribbons while compounds are represented as ball and stick. Hydrogen bonds are represented as black dashes. Water molecules seen in and around the cavity are shown as blue spheres. (b) Determination, by HTRF assays, of the half maximal inhibitory concentration (IC50) of the SDC2 cognate peptide (black) and SyntOFF (blue) for syntenin‐SDC2 complexes (c) Plot comparing the binding of compound C58 and SyntOFF to biotinylated‐syntenin PDZ tandem plus C‐terminal domain, as a function of compound concentration. Values correspond to binding at equilibrium as observed in BIAcore (compounds were in DMSO). (d) MCF7 and MCF7 SyntKO cells were treated with increasing concentration (0.1‐100 µM) of SyntOFF for 48h. Cell viability was assessed by flow cytometry. 10 µM H2O2 treatment was used as positive control. (e) MCF7 cells (left panel) and MCF7 or MCF7 SyntKO (right panel) cells were treated with vehicle (Ctrl, DMSO 0.2%) or with SyntOFF (50 & 100 µM, 100 µM right panel) and seeded at the same density to form mammospheres. The number of spheres (diameter > 50 µm) was evaluated under a microscope on days 7–10. Three independent experiments were performed. Sphere formation was calculated as the number of spheres divided by the original number of cells seeded and normalized to control ± sd. Statistical analysis was performed using the one‐way analysis of variance (ANOVA) with a Bonferroni posttest (*P < 0.05; **P < 0.01; ***P < 0.001)
