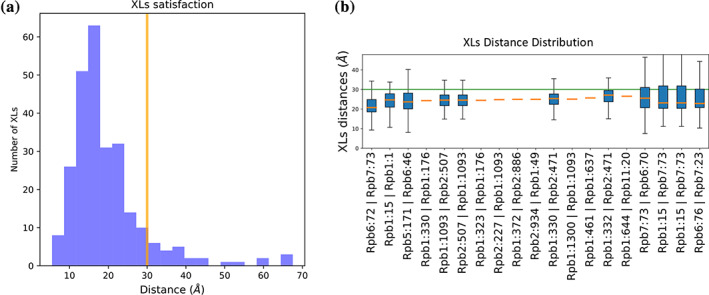
FIGURE 4.

Evaluation of crosslink satisfaction. (a) Histogram of mean crosslink distances for Cluster 0 showing that the majority of observed crosslinks are satisfied at the 30 Å cutoff value (yellow line). (b) Individual crosslink distance distributions for a subset of crosslinks used to model the complex. The identity of each crosslink is noted in the X‐axis label in the format “Protein1:Residue1 | Protein2:Residue2”. The total range of crosslink distances in the cluster are shown by the whiskers while the 25th to 75th percentile is represented by the blue boxed. The median crosslink distance is represented by an orange line. The 30 Å cutoff value is shown in the green line. Crosslinks that show a fixed distance (orange dashes) have both residue endpoints located in the rigid body subcomplex of this model. The figure containing all crosslink distributions is found in ./rnapolii/analysis /model_analysis/ plot_XLs_distance_distributions_cl1.pdf
