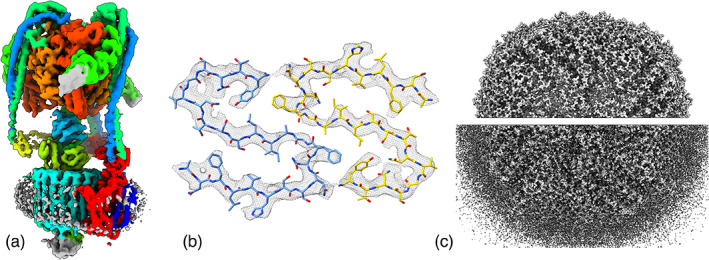
FIGURE 3.

Visualizing electron microscopy maps. (a) Color molecular components from a fit atomic model, command color zone, mammalian V‐ATPase (EMDB 21317). (b) Density near atoms, command volume zone, islet amyloid fibril (EMDB 10669). (c) Hide small density blobs, command surface dust, apoferritin at 1.2 Å resolution 32
