
Figure 1.
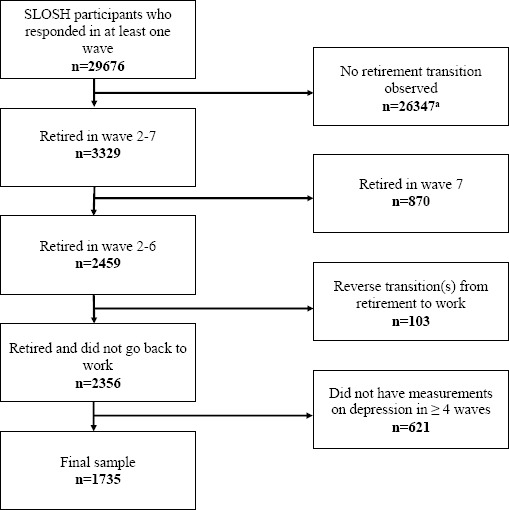
Flowchart illustrating the sample selection from SLOSH 2006–2018. a Among the 26 347 participants who were excluded, some individuals did not respond in ≥2 waves, some individuals remained working, and some made transitions from or to work/non-work other than retirement.