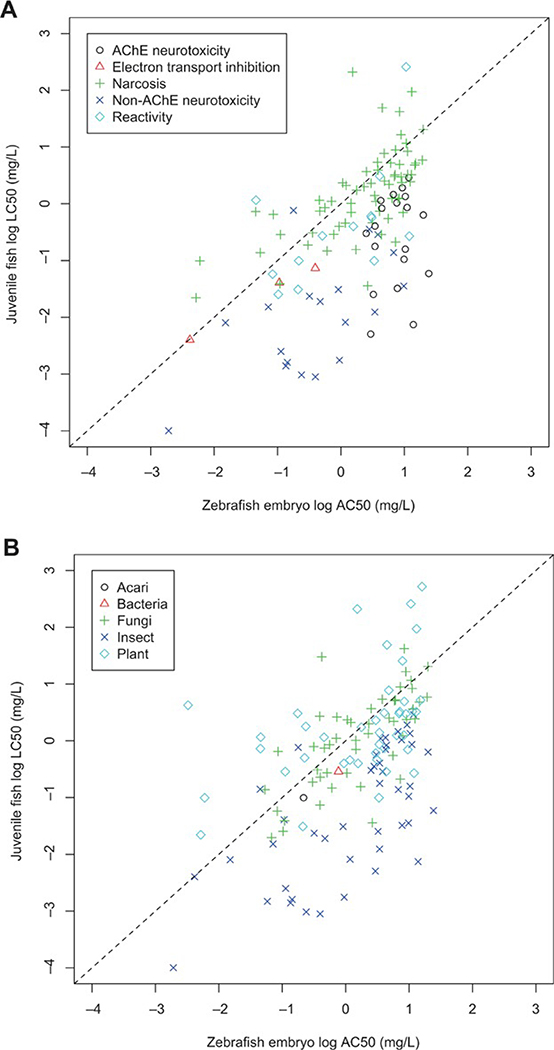
Figure 1.
Scatterplots of zebrafish embryo log10 half-maximal activity concentration (AC50; x-axis) and juvenile fish log10 96-h median lethal concentration (LC50; y-axis) values by (A) chemical mode-of-action and (B) pesticide target group. Dotted line represents a 1:1 toxicity relationship between fish embryo (x-axis) and juvenile fish (y-axes) toxicity values. AChE = acetyl cholinesterase.

