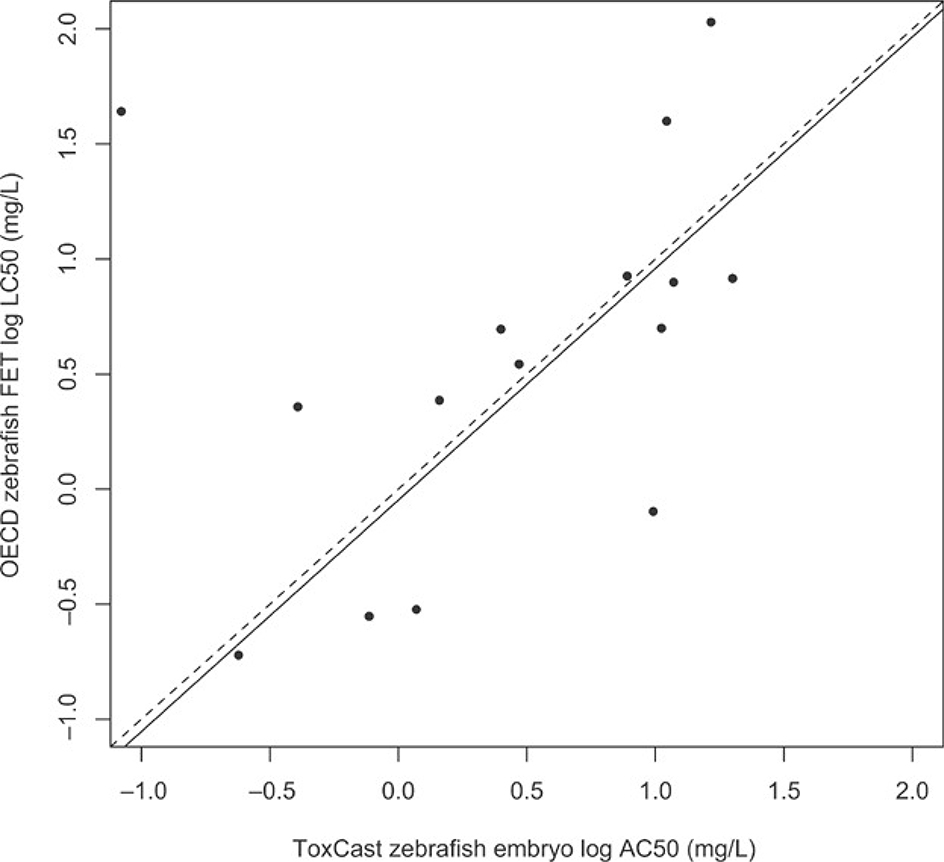
Figure 2.
Scatterplot of zebrafish embryo data generated by the US Environmental Protection Agency’s ToxCast Program (x-axis) and under the Organisation for Economic Co-operation and Development (OECD) Fish Embryo Toxicity Test (FET) Protocol (y-axis). Dotted line represents a 1: toxicity relationship between the x- and y-axes. Solid line represents the best-fit relationship between the 2 datasets based on linear regression. Note: outlier (chlorothalonil) was removed before linear regression was performed. AC50 = half-maximal activity concentration; LC50 = median lethal concentration.

