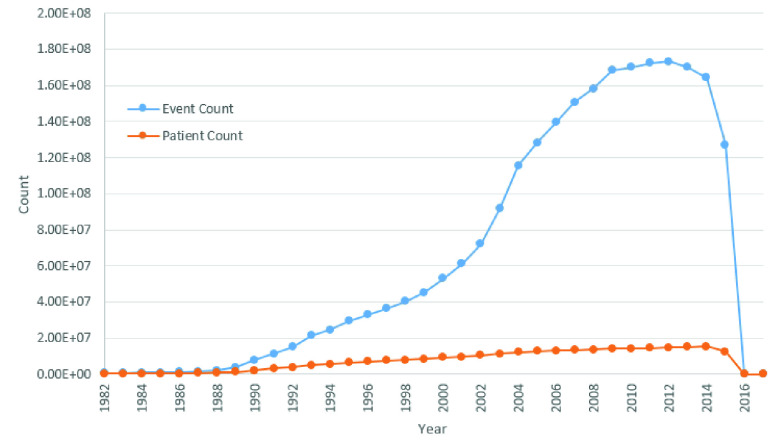
FIGURE 2.
Graph indicating distribution of patient and event counts aggregated by year across the GP and PEDW datasets used for evaluation. As shown, the majority of patients and events span across a timeframe between 1982 to 2015. Of note, is the non-linear correlation between patient count and event count highlighting an increased frequency of recorded events over the years.

