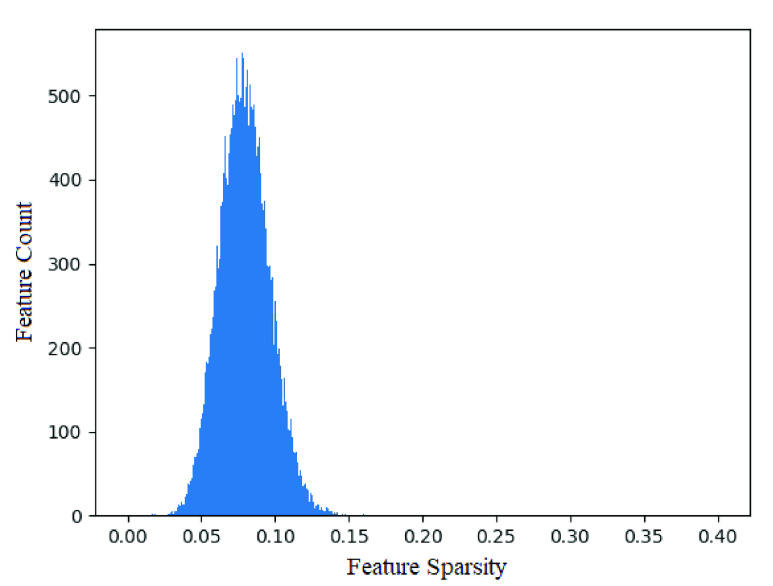
FIGURE 3.
Histogram of features over mean importance factor across all snapshot ensembles of a randomly selected cross-validation run. As seen, the majority of features are normally distributed ( ) around a low overall feature sparsity value, indicating the majority of features introduced to ECNN are of low importance in prediction of hospitalization. Unable to be effectively shown, due to graph scaling constraints, 10 features lie outside 3 standard deviations of the distribution, shown in table 4.

