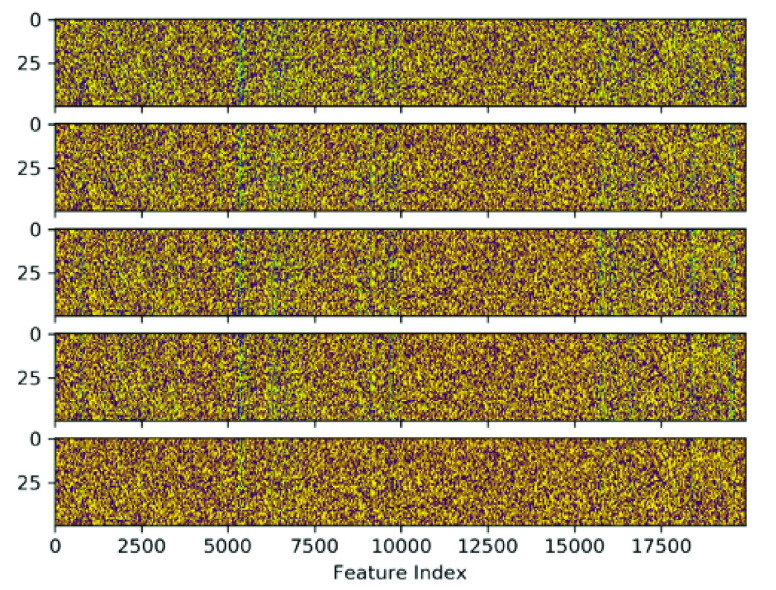
FIGURE 5.
Heat map of individual weights of the first layer across the five snapshot ensemble models of a single cross-validation run where yellow hot are values close to 1 and purple cold are values close to 0. As seen, most weights have converged to values close to {0, 1} indicating the success of entropy regularization. Rough patterning between each heat map indicates a potential pattern in variation between each ensemble. As similarities and differences between each ensemble weight matrix are difficult to see, Fig. 5 provides a clear indication of the feature-wise variation.

