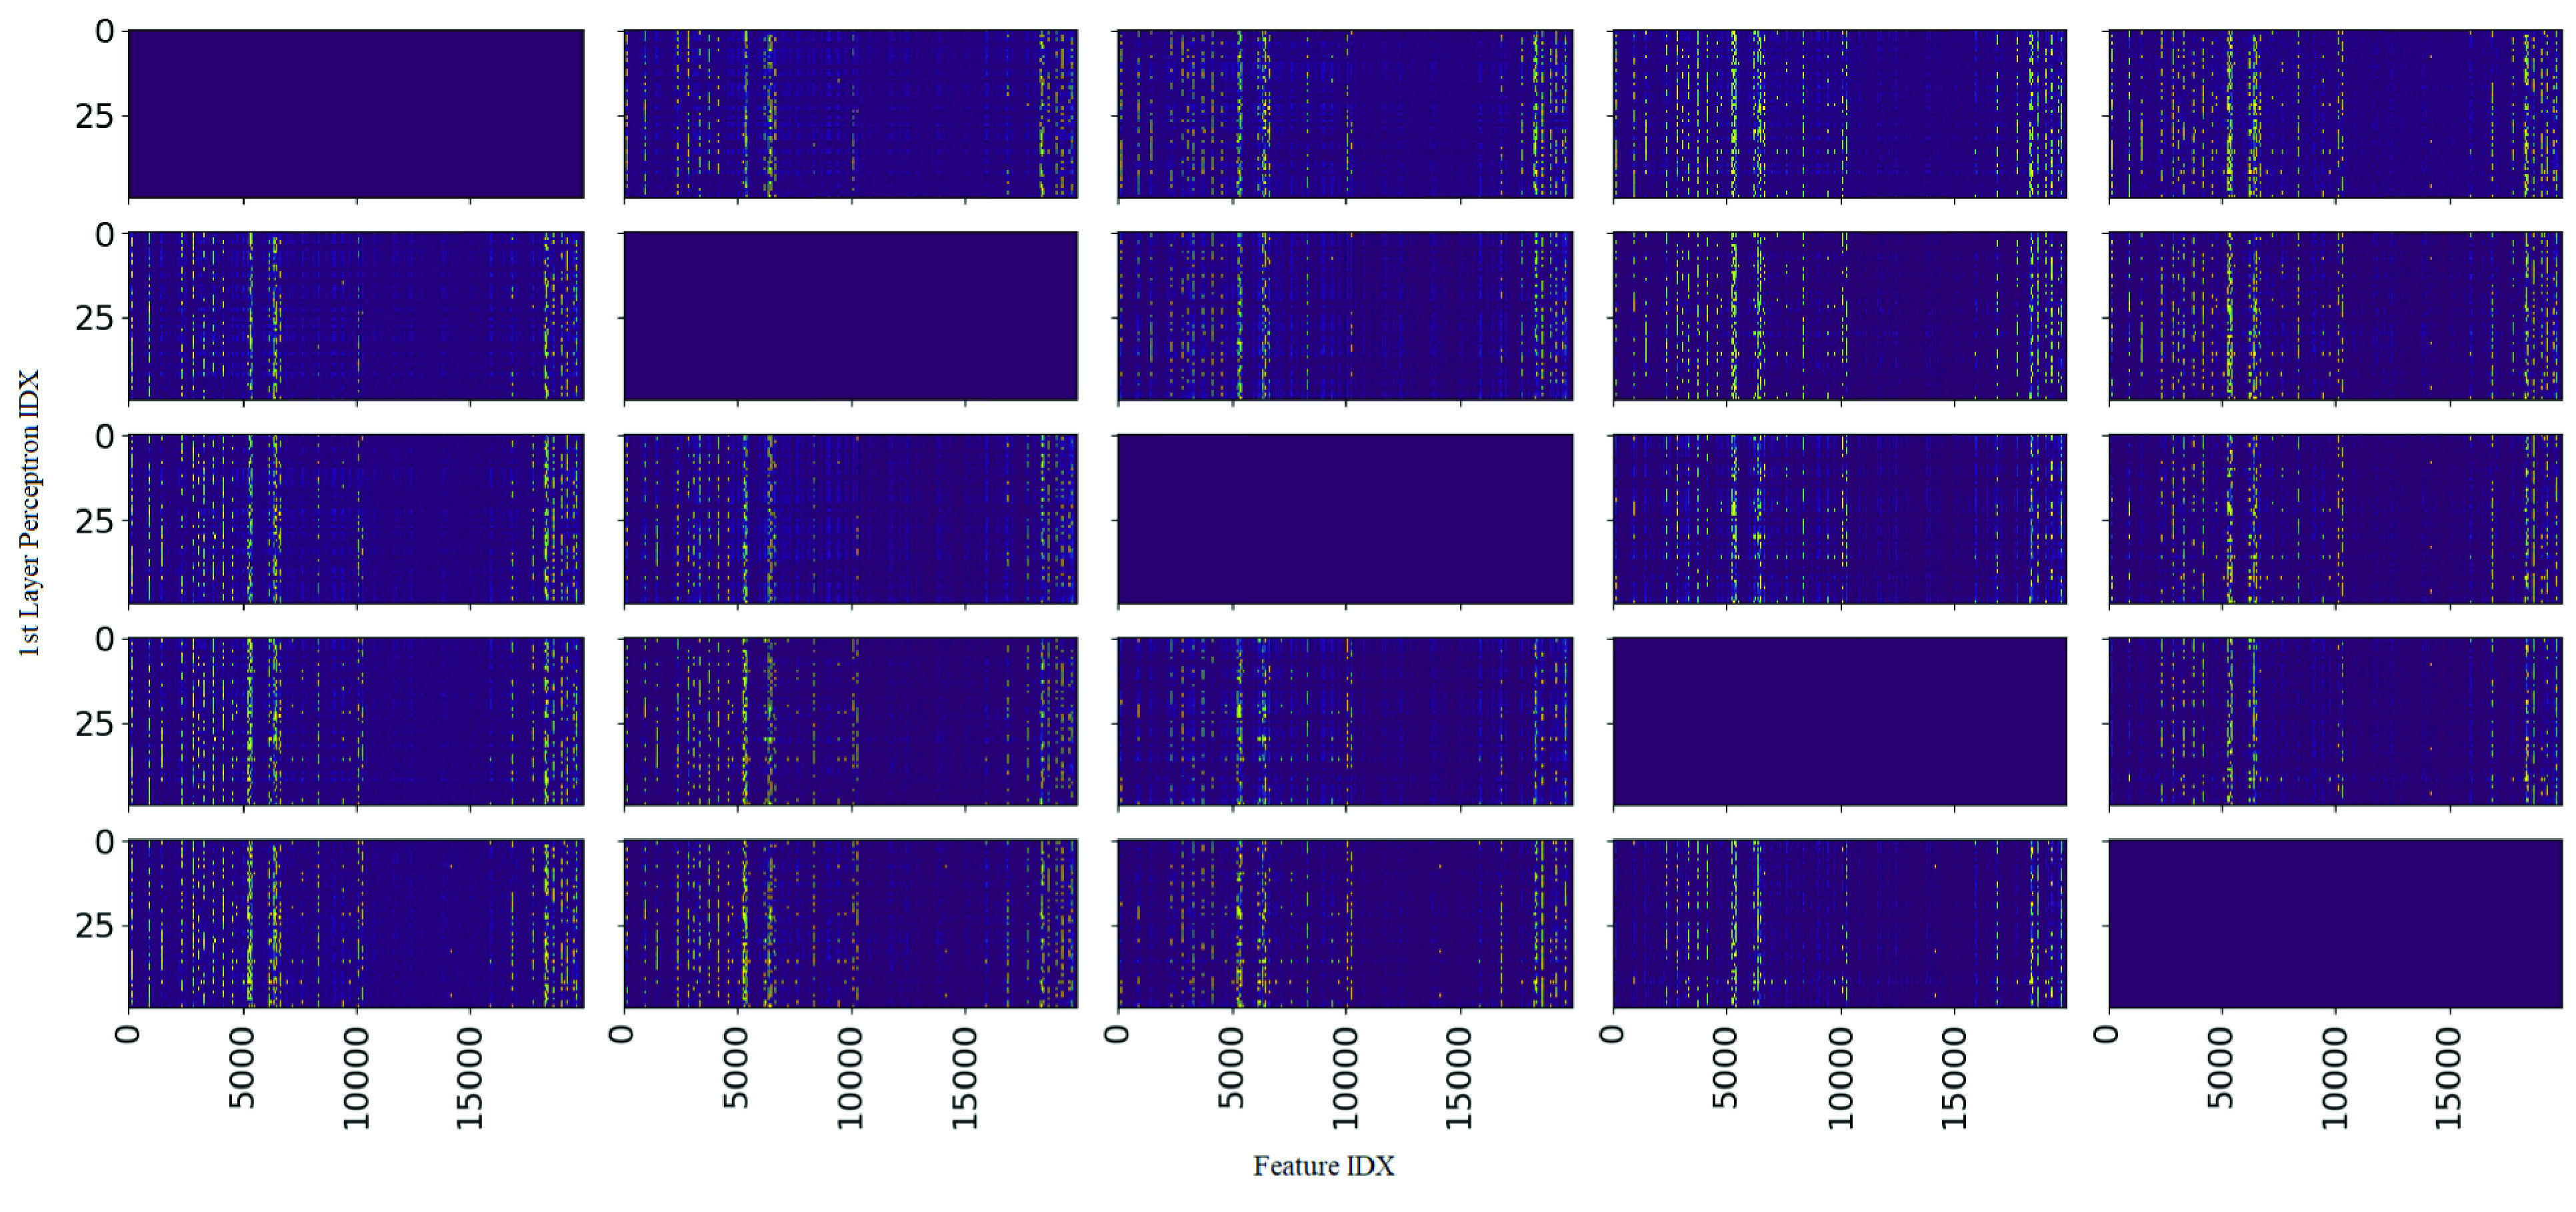
FIGURE 6.

Shown, is a complete comparative heat map matrix of the absolute differences in weights between the first hidden layer of every possible pair of the 5 produced snapshot ensembles. Colour values are mapped so that yellow hot represents values close to 1 whilst purple cold represent values close to 0. Left-top to right-bottom diagonals show weight difference between the same ensemble and are thus irrelevant for analysis. Of note, the vertical patterning for each heat map indicates any weight differences between snapshot pairs are focused on specific individual features across all snapshot pairs. This suggests a convergence in importance factor for the vast majority of features with a small but consistent subset of edge-case features producing variation amongst the snapshot ensembles.
