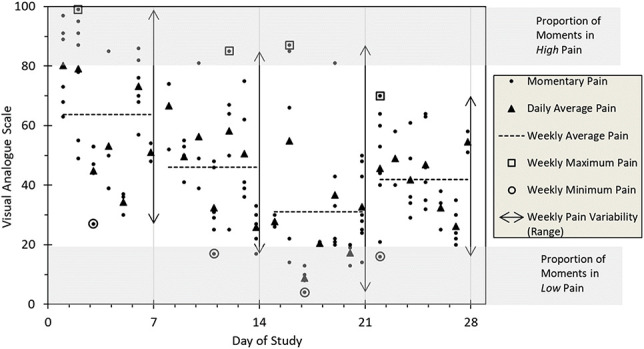
Figure 1.

Variability in Pain Intensity and selected summary statistics that can be computed from EMA to characterize a patient's pain in daily life. X-axis ticks represent 28 sequential days of EMA monitoring for a single fibromyalgia patient. EMA, Ecological Momentary Assessment.
