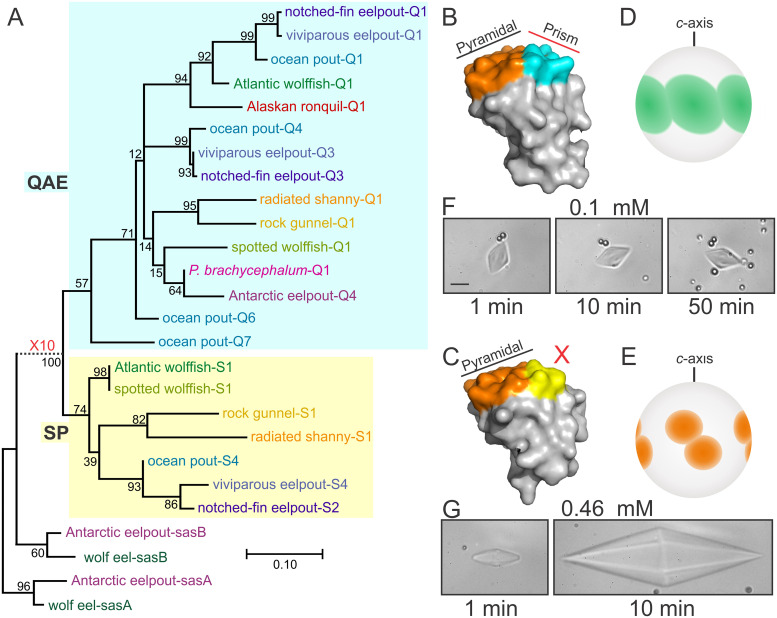
Fig 3. Phylogenetic and functional comparison of type III AFPs.
A) A maximum-likelihood phylogenetic tree of the nucleotide sequences (S4 Fig) of the subset of type III AFP sequences shown in Fig 2. Cyan and yellow backing denotes QAE and SP isoforms respectively and bootstrap values (percent) are indicated at most nodes. The scale bar represents an average of 0.1 or 1 changes per site for solid and dashed lines respectively. B) and C) Representative structure of a QAE (PDB:4UR4) and SP isoform (PDB:4UR6) respectively [53] with the pyramidal and prism ice-binding surfaces colored orange and cyan respectively [78]. D) and E) Diagram of the fluorescent ice-plane affinity of a QAE and SP isoform respectively, adapted from previously published images [79]. F) and G) Ice crystals in the presence of 0.1 mM of a fully-active QAE isoform (M1.1, [91]) and 0.46 mM of an SP isoform (notched-fin eelpout-S5, S3 Fig [27]) respectively. Samples were cooled at a rate of 0.01°C/6 sec for one min then held for the indicated times at 0.1°C below the melting point. The scale bar represents 10 μm.

