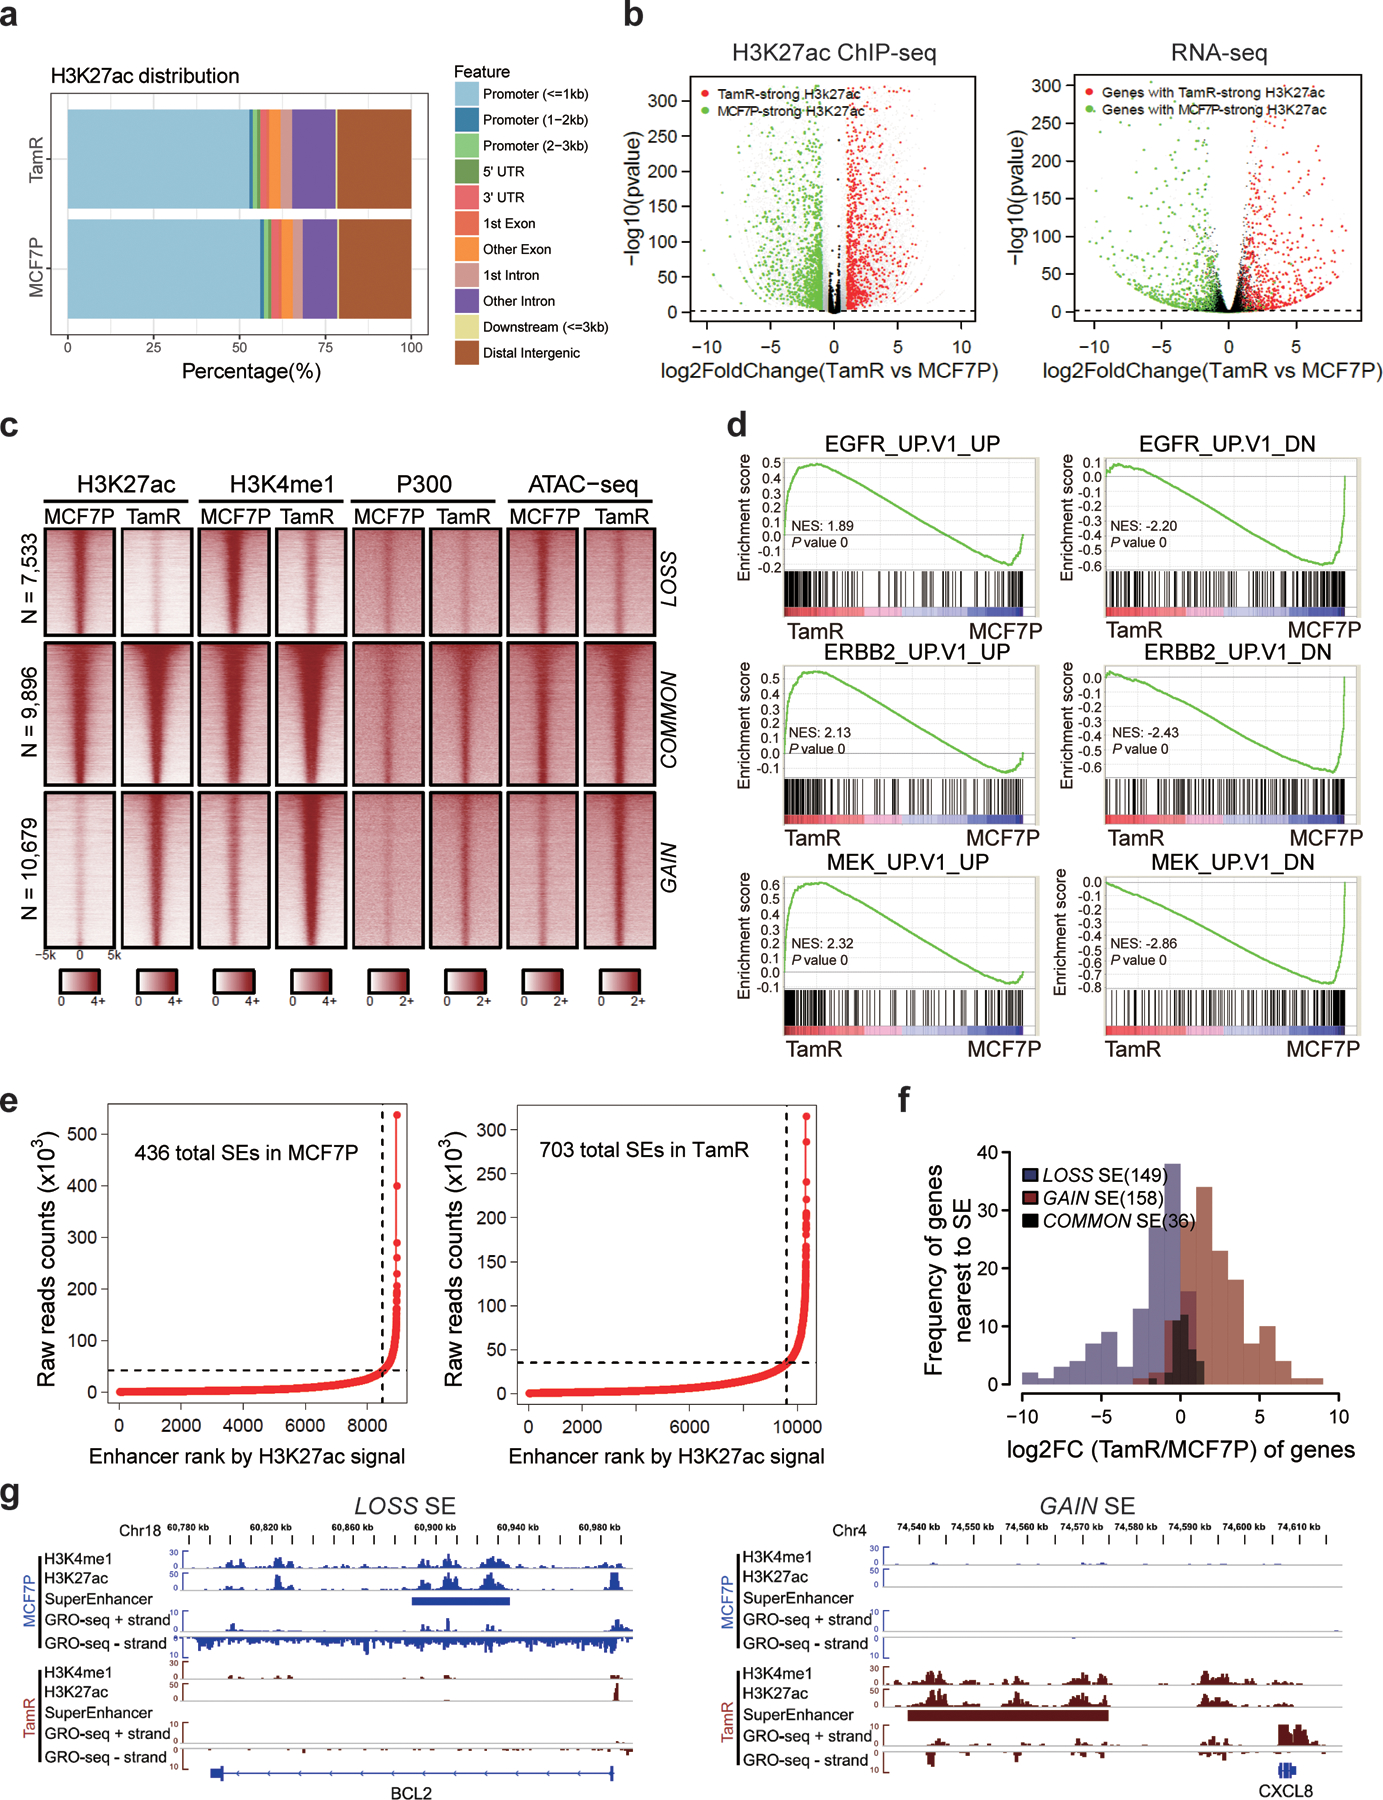
Extended Data Fig. 3. Endocrine resistance accompanies global enhancer reprogramming that drives plasticity-related gene transcription.

a, Genomic annotations of the H3K27ac ChIP-seq signals in MCF7P and TamR cell lines.
b, Volcano plots showing the changes of H3K27ac signals at promoter regions correlate well with the changes in gene expression detected by RNA-seq in TamR cells. n=2 biologically independent experiments, and P values were determined by Wald test with Benjamini-Hochberg adjustment.
c, Heatmap of H3K27ac, H3K4me1 and P300 ChIP-seq data for all identified lost, common and gained enhancers genome wide. Chromatin accessibility profiled by ATAC-seq at the corresponding genomic regions is also shown on the right.
d, GSEA analyses on RNA-seq data showing the enrichment of oncogenic signatures from MSigDB database in MCF7P or TamR cells. The nominal P values were determined by empirical gene-based permutation test.
e, Total super-enhancers (SEs) in MCF7P and TamR cell lines identified by the ROSE program ranked by H3K27ac signal intensities.
f, Histograms of the log2(Fold Change) of genes nearest to the differential SEs showing that gained SEs correlate with gene upregulation and lost SEs correlate with gene downregulation.
g, Genome browser snap images of lost SE at BCL2 locus and gained SE at CXCL8 locus. The SE gain/loss correlates well with gene upregulation and downregulation detected by GRO-seq.
