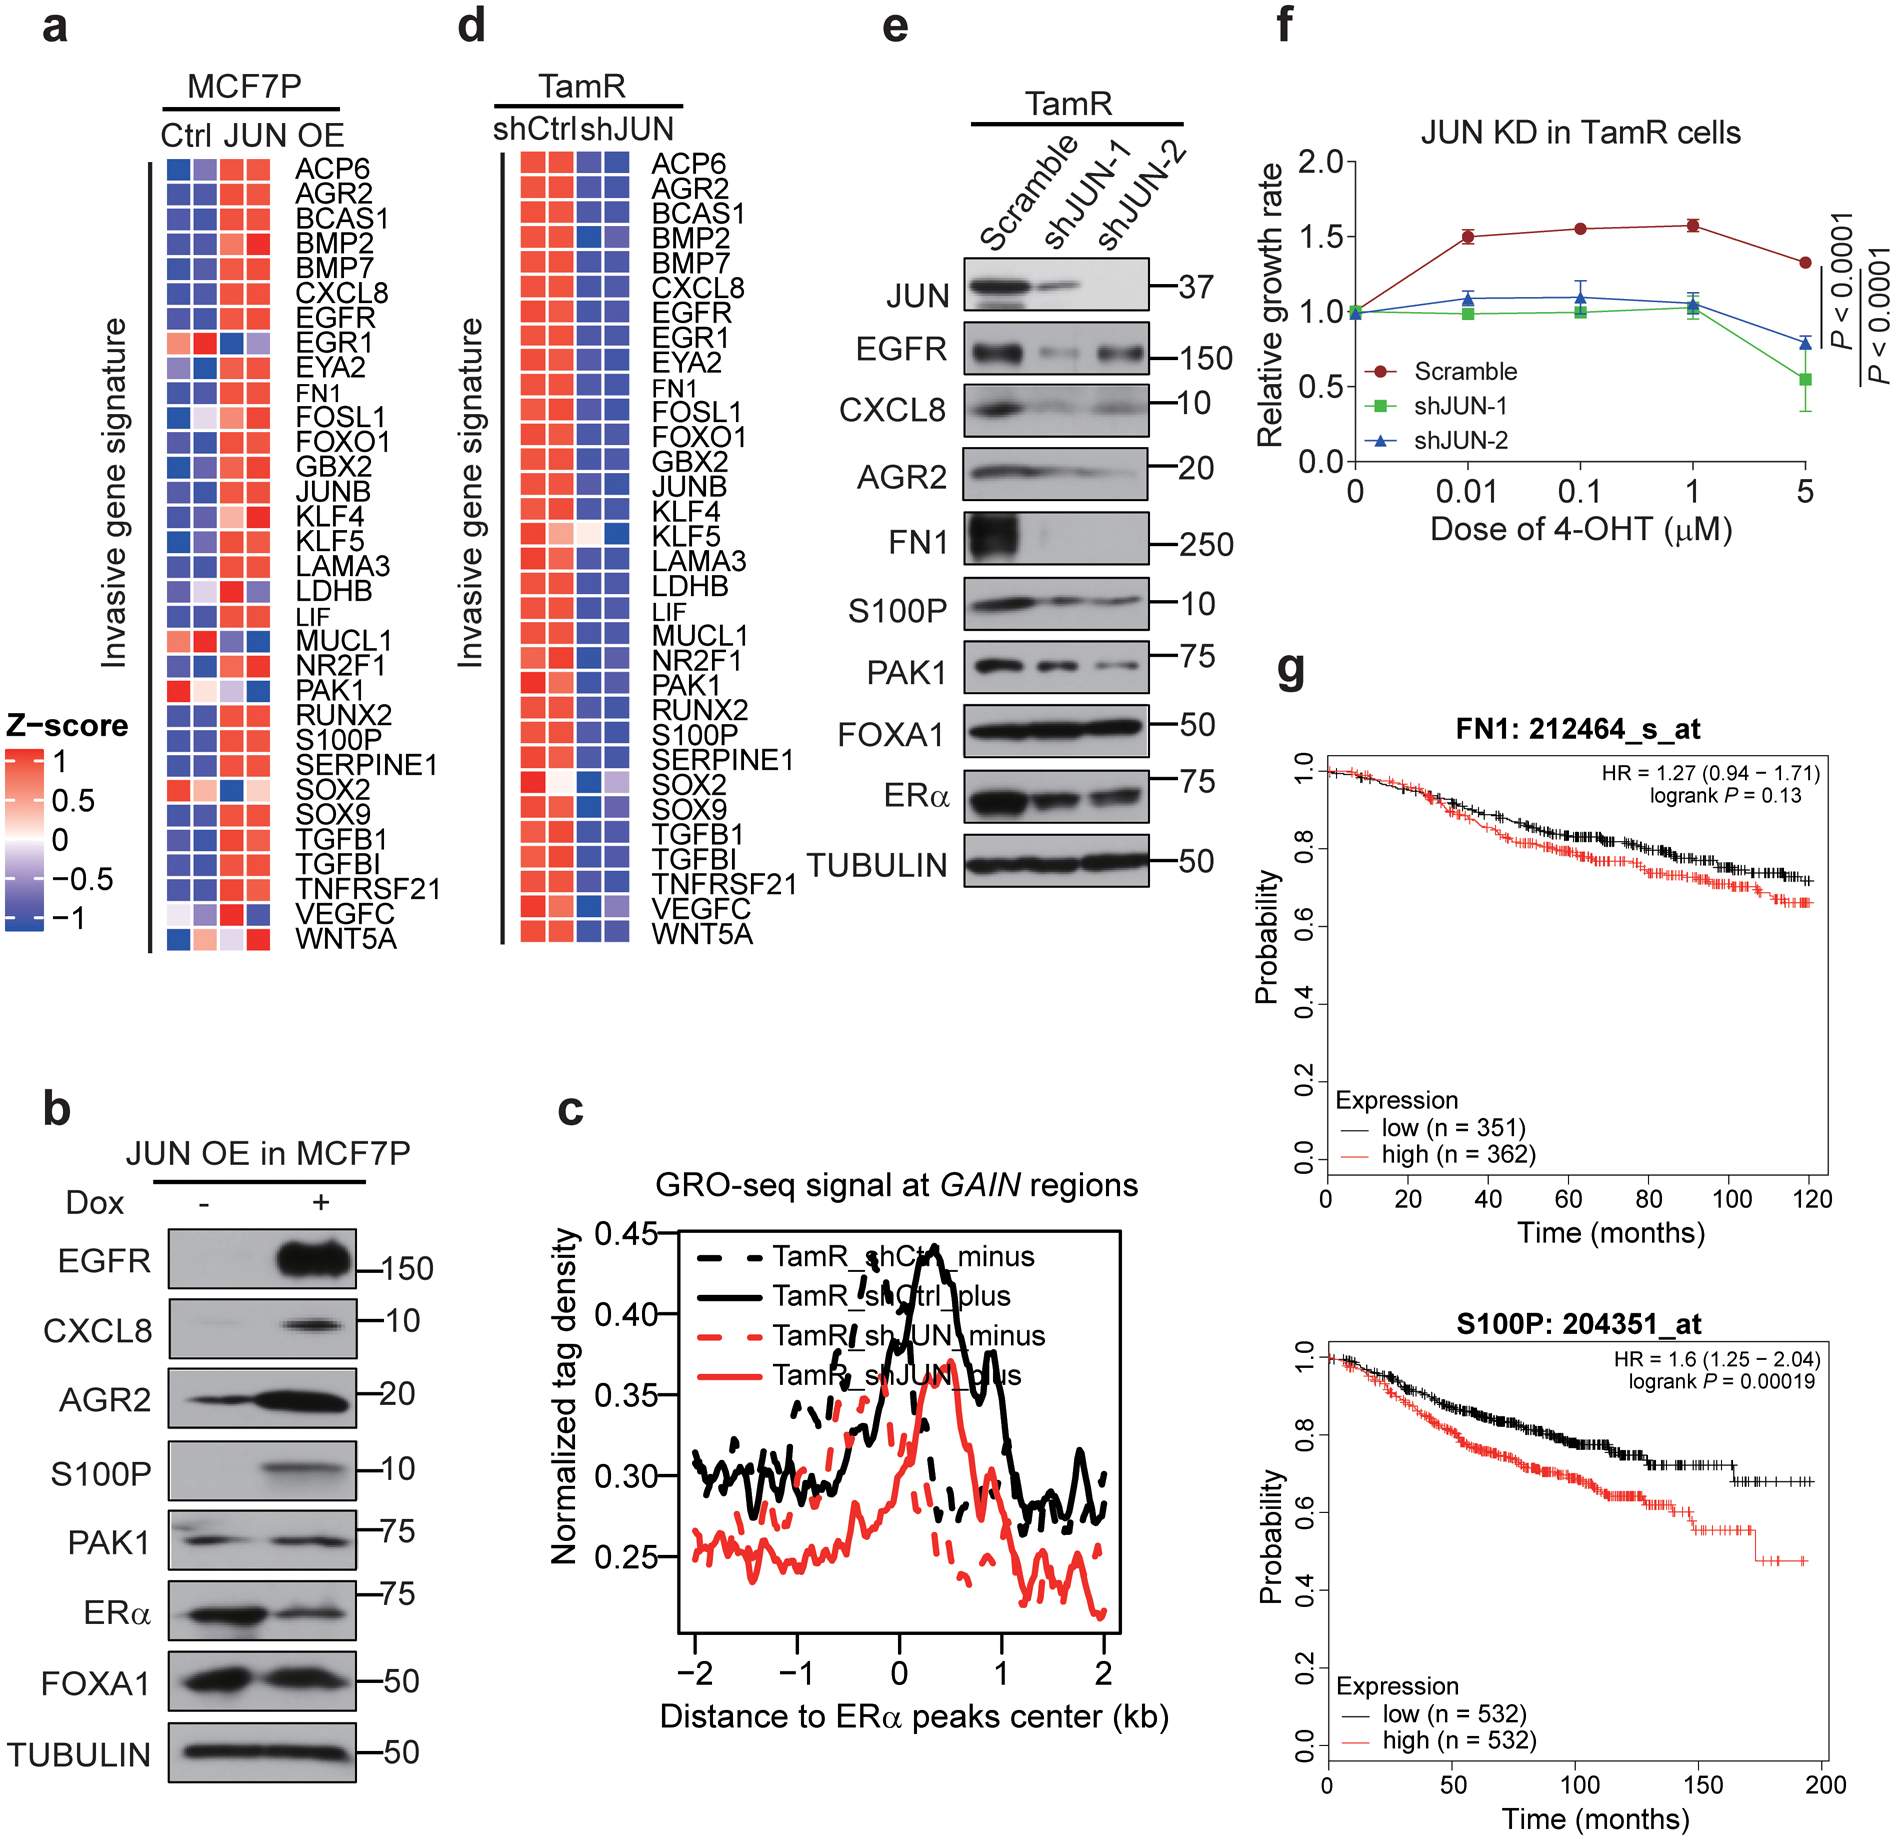
Extended Data Fig. 6. AP1-mediated GAIN enhancer activation promotes endocrine resistance-associated gene program and phenotypes.

a, Heatmap depiction of the upregulation of indicated invasive genes after JUN overexpression in MCF7P cells. n=2 biologically independent experiments.
b, Western blot images of indicated invasive markers in MCF7P cells with or without JUN overexpression, showing that JUN overexpression is sufficient to activate the expression of these invasive markers.
c, Aggregate plots of the normalized GRO-seq tag density at GAIN enhancers in TamR cells transduced with shCtrl or shJUN lentiviruses showing that knockdown of JUN greatly reduces eRNA transcription due to enhancer inactivation. The dashed and solid lines represent the minus and plus strands of eRNA respectively.
d, Heatmap depiction of the downregulation of indicated invasive genes after JUN knockdown in TamR cells. n=2 biologically independent experiments.
e, Western blot analyses on indicated invasive markers in TamR cells transduced with a scramble control or two different lentiviral shRNAs for JUN, showing that JUN is required for the expression of these invasive markers.
f, Knockdown of JUN in TamR cells re-sensitizes them to 4-OHT. TamR cells were stably knocked down with shJUN (a scramble shRNA was used as control) and CCK8 assays were used to check the relative cell viability of cells after treatment with indicated 4-OHT concentrations for 5 days. Data are presented as mean ± s.d. from n=3 independent experiments. P values were determined by two-sided t-tests.
g, Relapse free survival (RFS) curves according to FN1 and S100P gene expression levels in patients receiving endocrine therapy. The curves were generated using data from kmplot website. P values were determined by log-rank test. n numbers for different groups of patients were listed in the figure.
Immunoblots are representative of two independent experiments. Unprocessed immunoblots are shown in Source Data Extended Data Fig. 6. Statistical source data are available in Statistical Source Data Extended Data Fig. 6.
