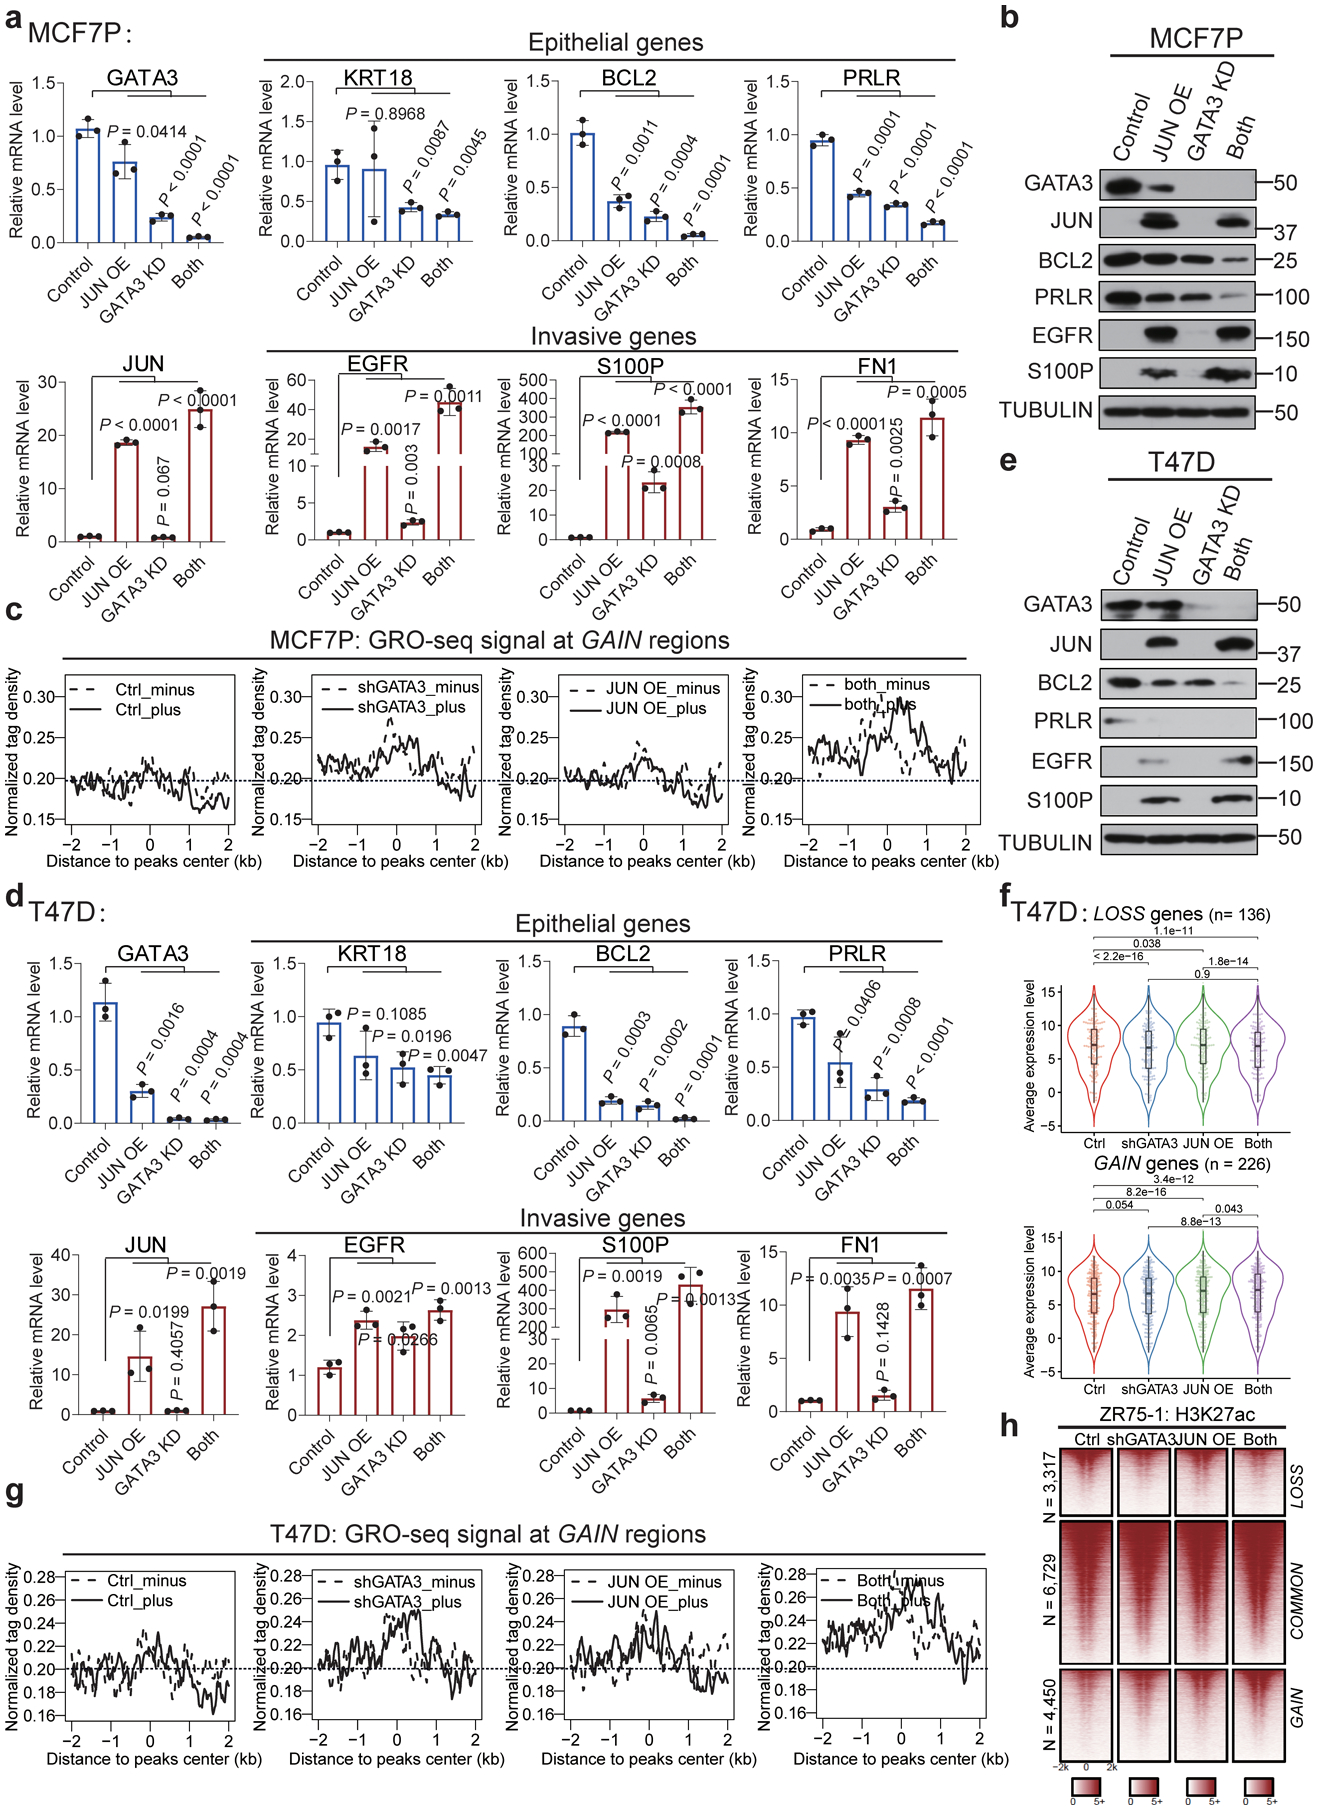
Extended Data Fig. 7. GATA3 and AP1 function coordinately to promote TamR-associated enhancer reprogramming and gene expression.

a, d, RT-qPCR analyses of selected epithelial markers and invasion-related genes in MCF7P (a) or T47D (d) cells with indicated manipulations, showing the coordinate gene regulation effects by GATA3 and JUN. Data are presented as mean ± s.d. P values were determined by two-sided t-tests.
b, e, Western blot analyses of selected epithelial markers and invasion-related genes in MCF7P (b) and T47D (e) cells with indicated manipulations, showing the coordinate role of GATA3 and JUN in regulating gene expression.
c, g, The aggregate plots of the normalized GRO-seq tag density at GAIN enhancers in MCF7P (c) and T47D (g) cells under indicated treatments. GATA3 KD and JUN OE demonstrate a synergistic effect on eRNA transcription. The dashed line represents the minus strand and solid line indicates the plus strand of eRNA.
f, Box plots representation of gene expression in T47D cells. Simultaneously depleting GATA3 and overexpressing JUN (“both”) shows a more dramatic effect on the lost and gained gene expression in T47D cells compared to manipulating individual gene alone. P values were calculated by Wilcoxon signed rank test. The lower and upper hinges correspond to the first and third quartiles, and the midline represents the median. The upper and lower whiskers extend from the hinge up to 1.5 * IQR (inter-quartile range). Outlier points are indicated if they extend beyond this range.
h, Heatmaps of H3K27ac ChIP-seq data at LOSS, COMMON and GAIN enhancers in ZR75–1 cells with the indicated treatments.
For a and d, the data are from n=3 independent experiments. Immunoblots are representative of two independent experiments. Unprocessed immunoblots are shown in Source Data Extended Data Fig. 7. Statistical source data are available in Statistical Source Data Extended Data Fig. 7.
