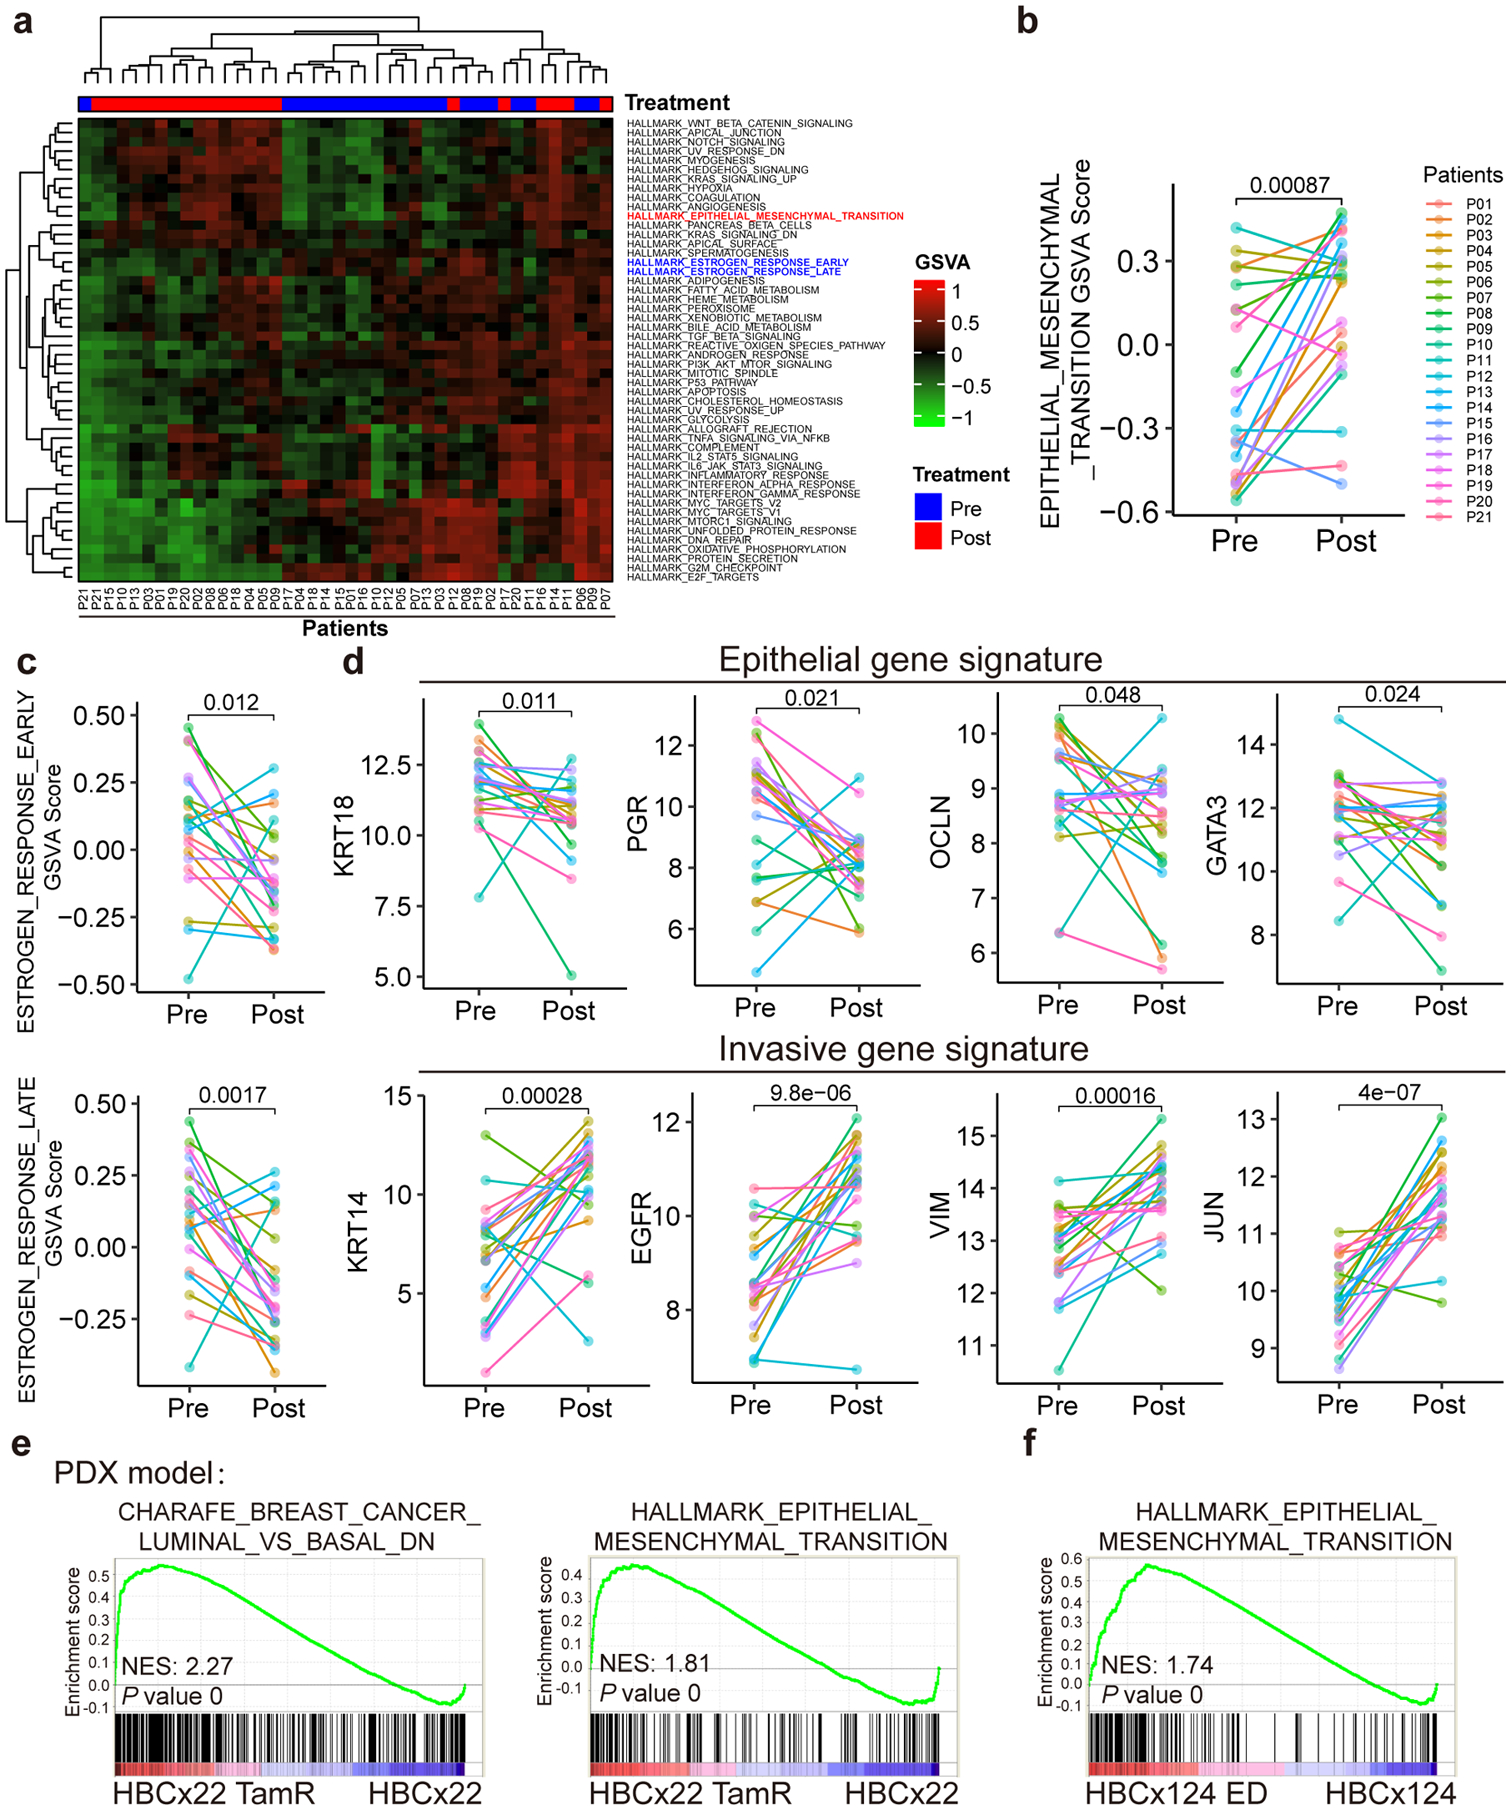
Fig. 2. Analyses using patient tumor tissues and PDX samples revealed phenotypic plasticity-enhancing transcriptional changes associated with therapy resistance.

a, Heatmap of unsupervised clustering of 21 pairs of RNA-seq data (before and after receiving chemoendocrine treatment) from 21 ER+ and HER2× breast cancer patients using Gene Set Variation Analysis (GSVA) analyses for the 50 cancer hallmark gene sets from the Molecular Signature Database (MsigDB). The results demonstrate that EMT gene signature is upregulated and estrogen response early/late gene signatures are downregulated post-treatment.
b-d, Line plot comparison of GSVA scores of EMT signature (b), estrogen response early/late signatures (c), and representative epithelial and invasive genes (d) for the paired RNA-seq data (pre- and post-treatment) from the 21 patients. The results show the downregulation of luminal/epithelial genes (including estrogen response early/late signatures) and the upregulation of EMT signature and representative invasive genes at post-treatment condition. n=21 biologically independent patient samples, and P values were determined by two-sided paired t-test.
e, GSEA analysis of microarray data for paired parental (HBCx22) vs tamoxifen-resistant (HBCx22 TamR) PDX tumor samples showing the downregulation of luminal markers and upregulation of EMT markers in tamoxifen-resistant PDX samples. n=2 independent samples and the nominal P values were determined by empirical gene-based permutation test.
f, GSEA analysis of RNA-seq data for paired parental (HBCx124) vs estrogen deprivation derived resistant (HBCx124 ED) PDX tumor samples showing that the EMT gene signatures were upregulated in hormone-independent PDX samples. n=2 independent samples and the nominal P values were determined by empirical gene-based permutation test.
Statistical source data are available in Statistical Source Data Fig. 2.
