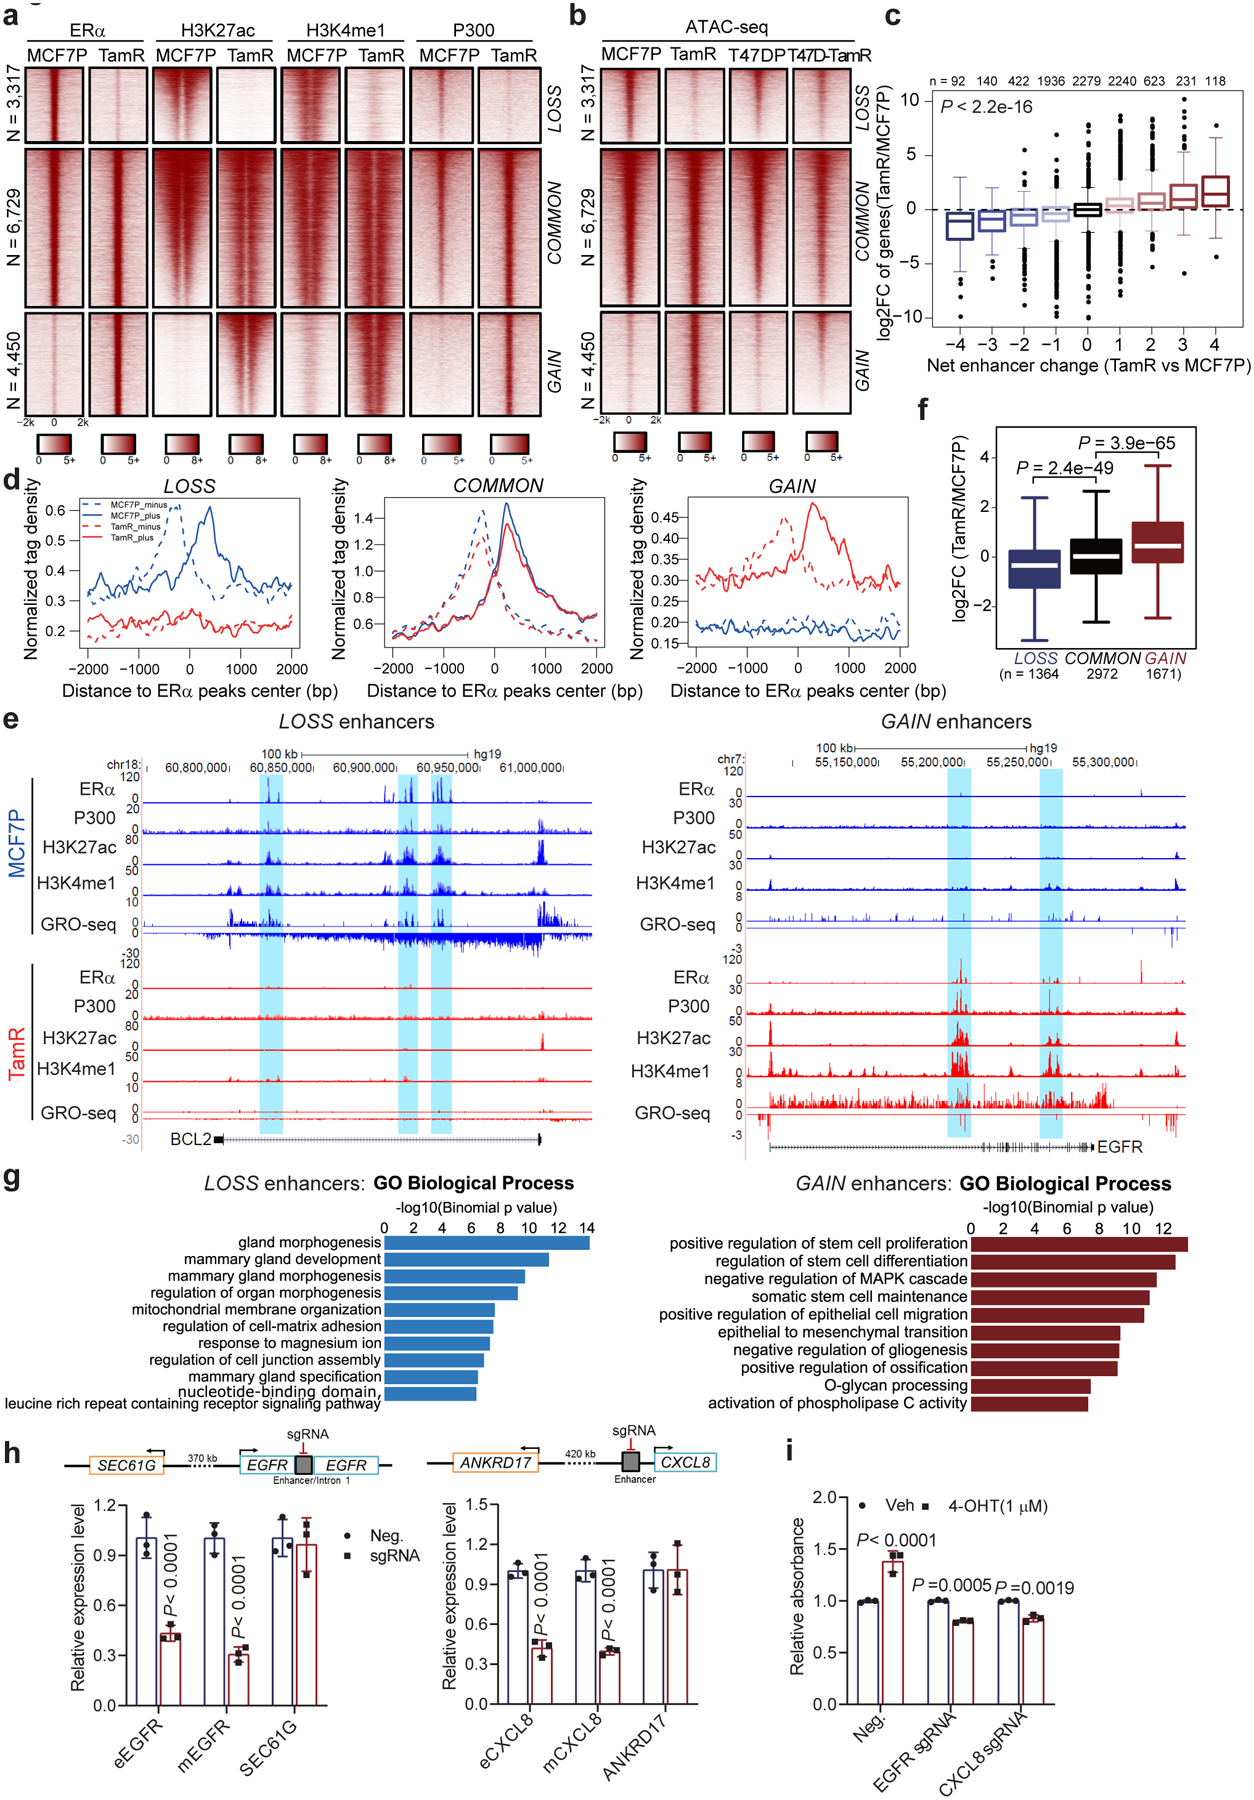
Fig. 3. Endocrine resistance accompanies global enhancer reprogramming that drives plasticity-related gene transcription.

a, Heatmaps of ERα, H3K27ac, H3K4me1, and P300 ChIP-seq data in MCF7P and TamR lines for the three groups of ERα-bound enhancers (LOSS, COMMON and GAIN).
b, Heatmaps of ATAC-seq data in two paired endocrine-resistant cell models (parental vs resistant).
c, Integration of RNA-seq and ChIP-seq data to correlate changes in gene expression with enhancer gain/loss. Box plots showing log2(Fold Change) of gene expression for all the genes stratified by the net enhancer change (total number of TamR-specific enhancers minus total number of MCF7P-specific enhancers) within 200 kb from the TSS site of each gene. Statistics: ANOVA analysis.
d, Aggregate plots of the normalized GRO-seq tag density at LOSS, COMMON and GAIN enhancers in MCF7P and TamR showing the correlation between enhancer activation and the transcription of eRNA (dashed line: minus strand; solid line: plus strand of eRNA).
e, Genome browser views of ChIP-seq and GRO-seq signals at representative ERα LOSS and GAIN enhancers and their target genes BCL2 and EGFR.
f, Box plot of the fold changes in expression level of genes adjacent to LOSS, COMMON and GAIN enhancers. Statistics: two-sided Wilcoxon rank-sum test.
g, GREAT analyses on the annotations of nearby genes of LOSS and GAIN enhancers. Top ten enriched annotations are shown. Statistics: one-sided binomial test.
h, Downregulation of both eRNA and mRNA for EGFR or CXCL8 upon CRISPRi-mediated enhancer repression in TamR cells. The close genes SEC61G and ANKRD17 served as controls.
i, Cell proliferation assays on TamR cells showing the re-sensitization of TamR cells to 4-OHT treatment after CRISPRi-mediated enhancer repression. Cell proliferation was measured by CCK8 after 6 days of treatment.
Statistics for h and i: n=3 independent experiments, mean ± s.d., two-sided t-tests.
For the box plots in c and f, the lower and upper hinges correspond to the first and third quartiles, and the midline represents the median. The upper and lower whiskers extend from the hinge up to 1.5 * IQR (inter-quartile range). Outlier points are indicated if they extend beyond this range.
Statistical source data are available in Statistical Source Data Fig. 3.
