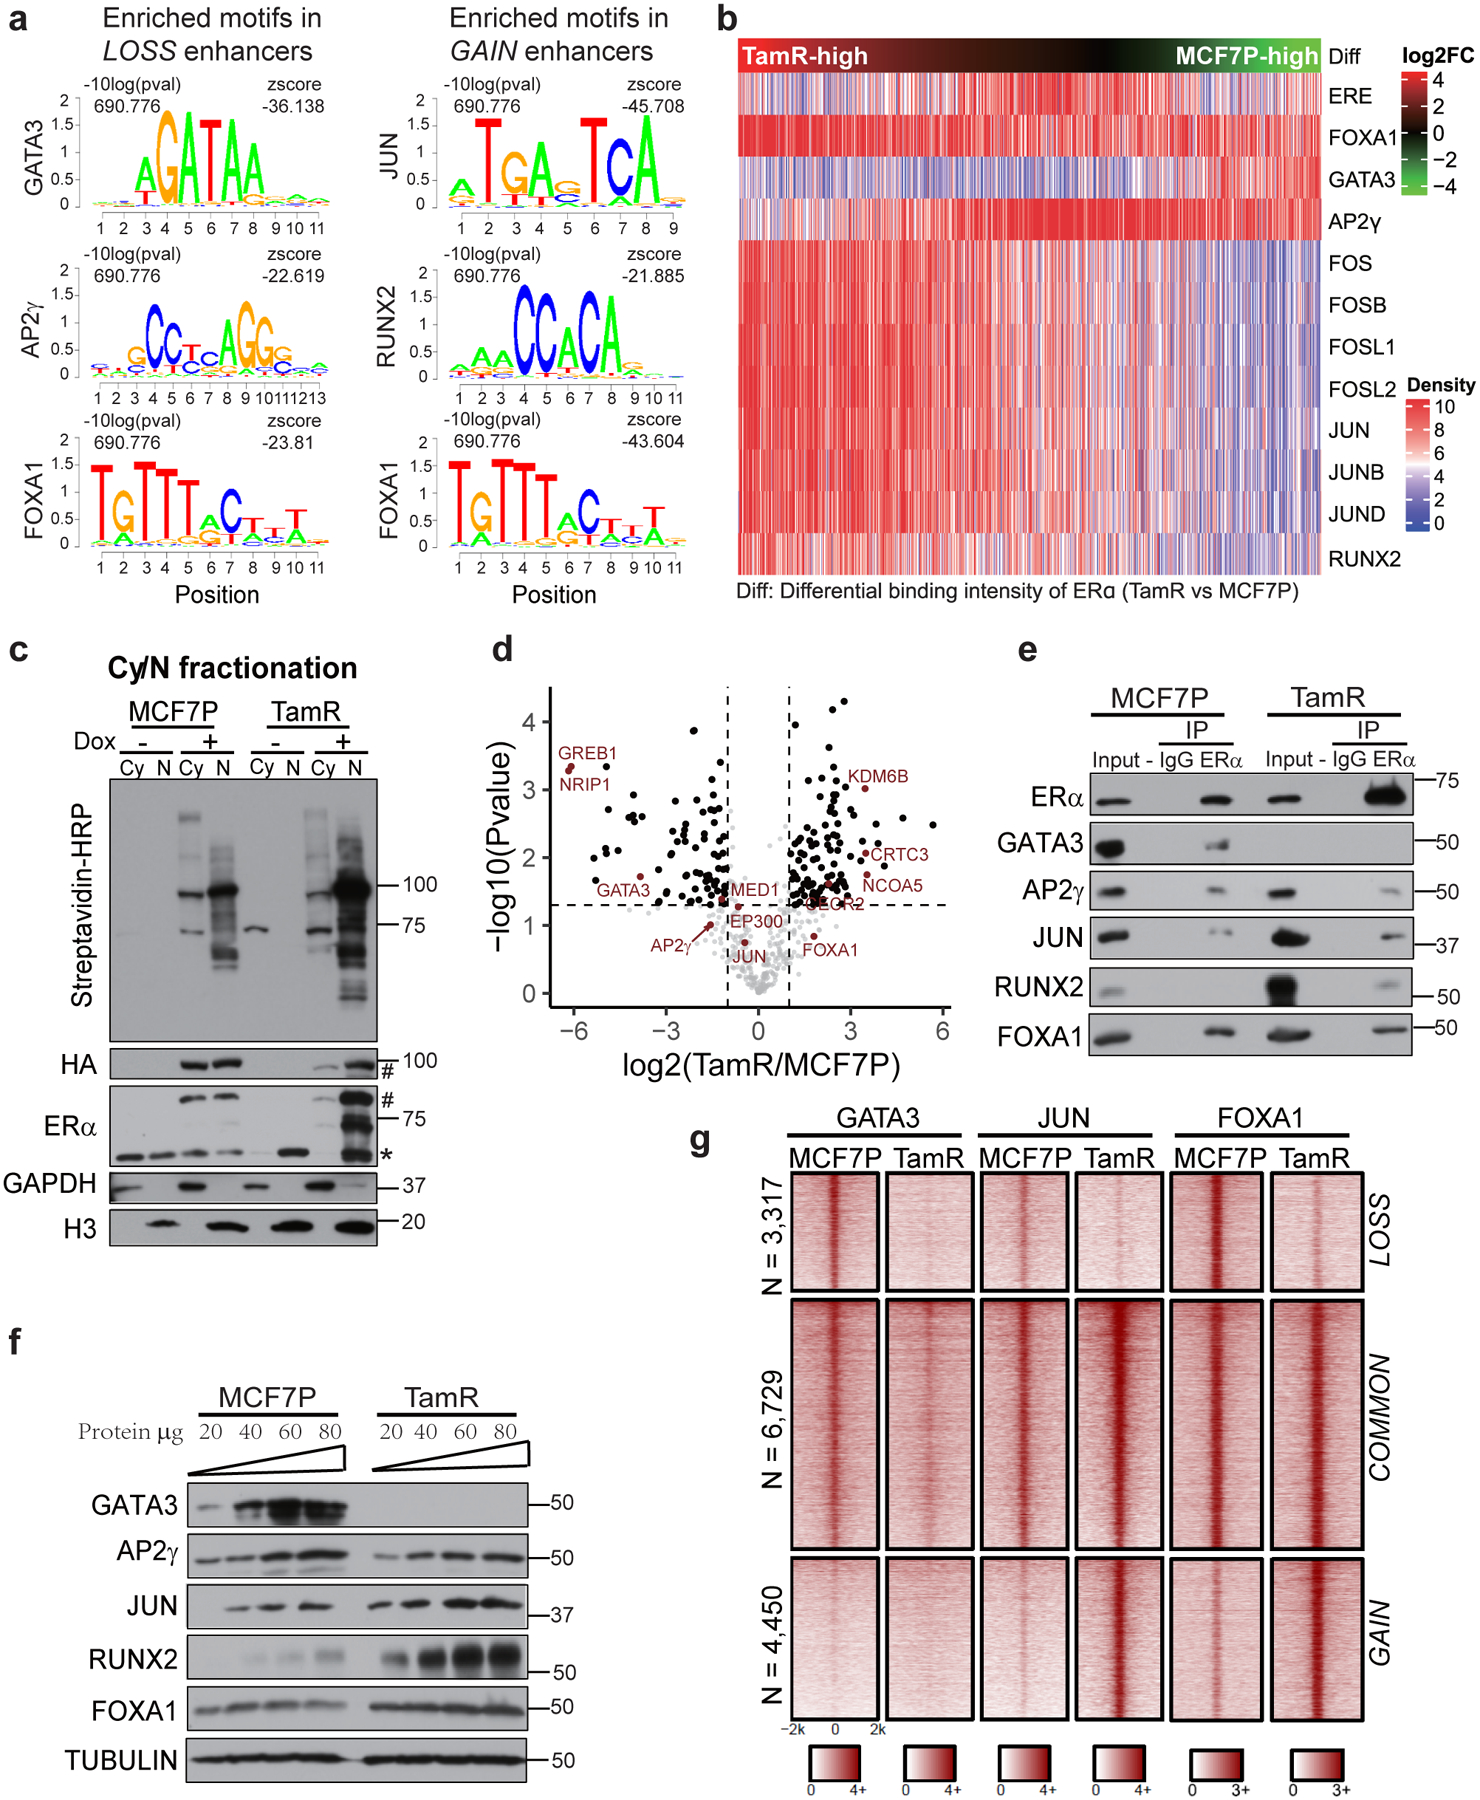
Fig. 4. High-order enhancer component assemblies mediated by differential TF-TF and TF-enhancer interactions correspond with endocrine resistance-associated enhancer reprogramming.

a, Enriched TF-binding motifs in different enhancer groups. P values were determined by one tailed Z-test.
b, Heatmap of motif densities for the listed TFs at all LOSS, COMMON and GAIN enhancers arranged by the binding intensities of ERα measured as the ratio of normalized ERα reads in TamR to MCF7P. A motif is considered occurred in an enhancer if the P value for the region with maximum score is less than 1e-4 by FIMO scanning of this enhancer.
c, Western blots confirming the inducible expression and in vivo biotinylation in the established ERα-BioID tet-on stable cell lines. The fractionation of cytoplasmic (Cy) and nuclear (N) fractions of MCF7P or TamR cells was confirmed with Western blots for GAPDH (cytoplasm-specific marker) and Histone H3 (nucleus-specific marker). The doxycycline-induced ERα-BirA*-HA fusion protein expression was detected by antibodies recognizing HA or ERα. * and # indicate endogenous and tagged exogenous ERα respectively. Proteins biotinylated by ERα-BirA* were detected using streptavidin-HRP blot.
d, Volcano plot showing the log2(LFQ) value for ERα-associated proteins identified in all four BioID replicates. Several ERα-interacting TFs and cofactors are highlighted in red. n=4 biologically independent experiments, and P values were determined by two-sided t-test.
e, Co-IP showing the interactions between ERα and indicated TFs in MCF7P and TamR. Endogenous ERα was immunoprecipitated using anti-ERα antibody, and IgG was used as a negative control.
f, Western blot analyses of the protein levels of indicated TFs in MCF7P and TamR cells. Tubulin was used as a loading control for different samples. (Note: GATA3 is non-detectable at the presented condition, but detectable with longer exposure).
g, Heatmaps of GATA3, JUN and FOXA1 ChIP-seq data in MCF7P and TamR demonstrating their differential occupancy on ERα-bound LOSS, COMMON and GAIN enhancers.
Immunoblots are representative of two independent experiments. Unprocessed immunoblots are shown in Source Data Fig. 4.
