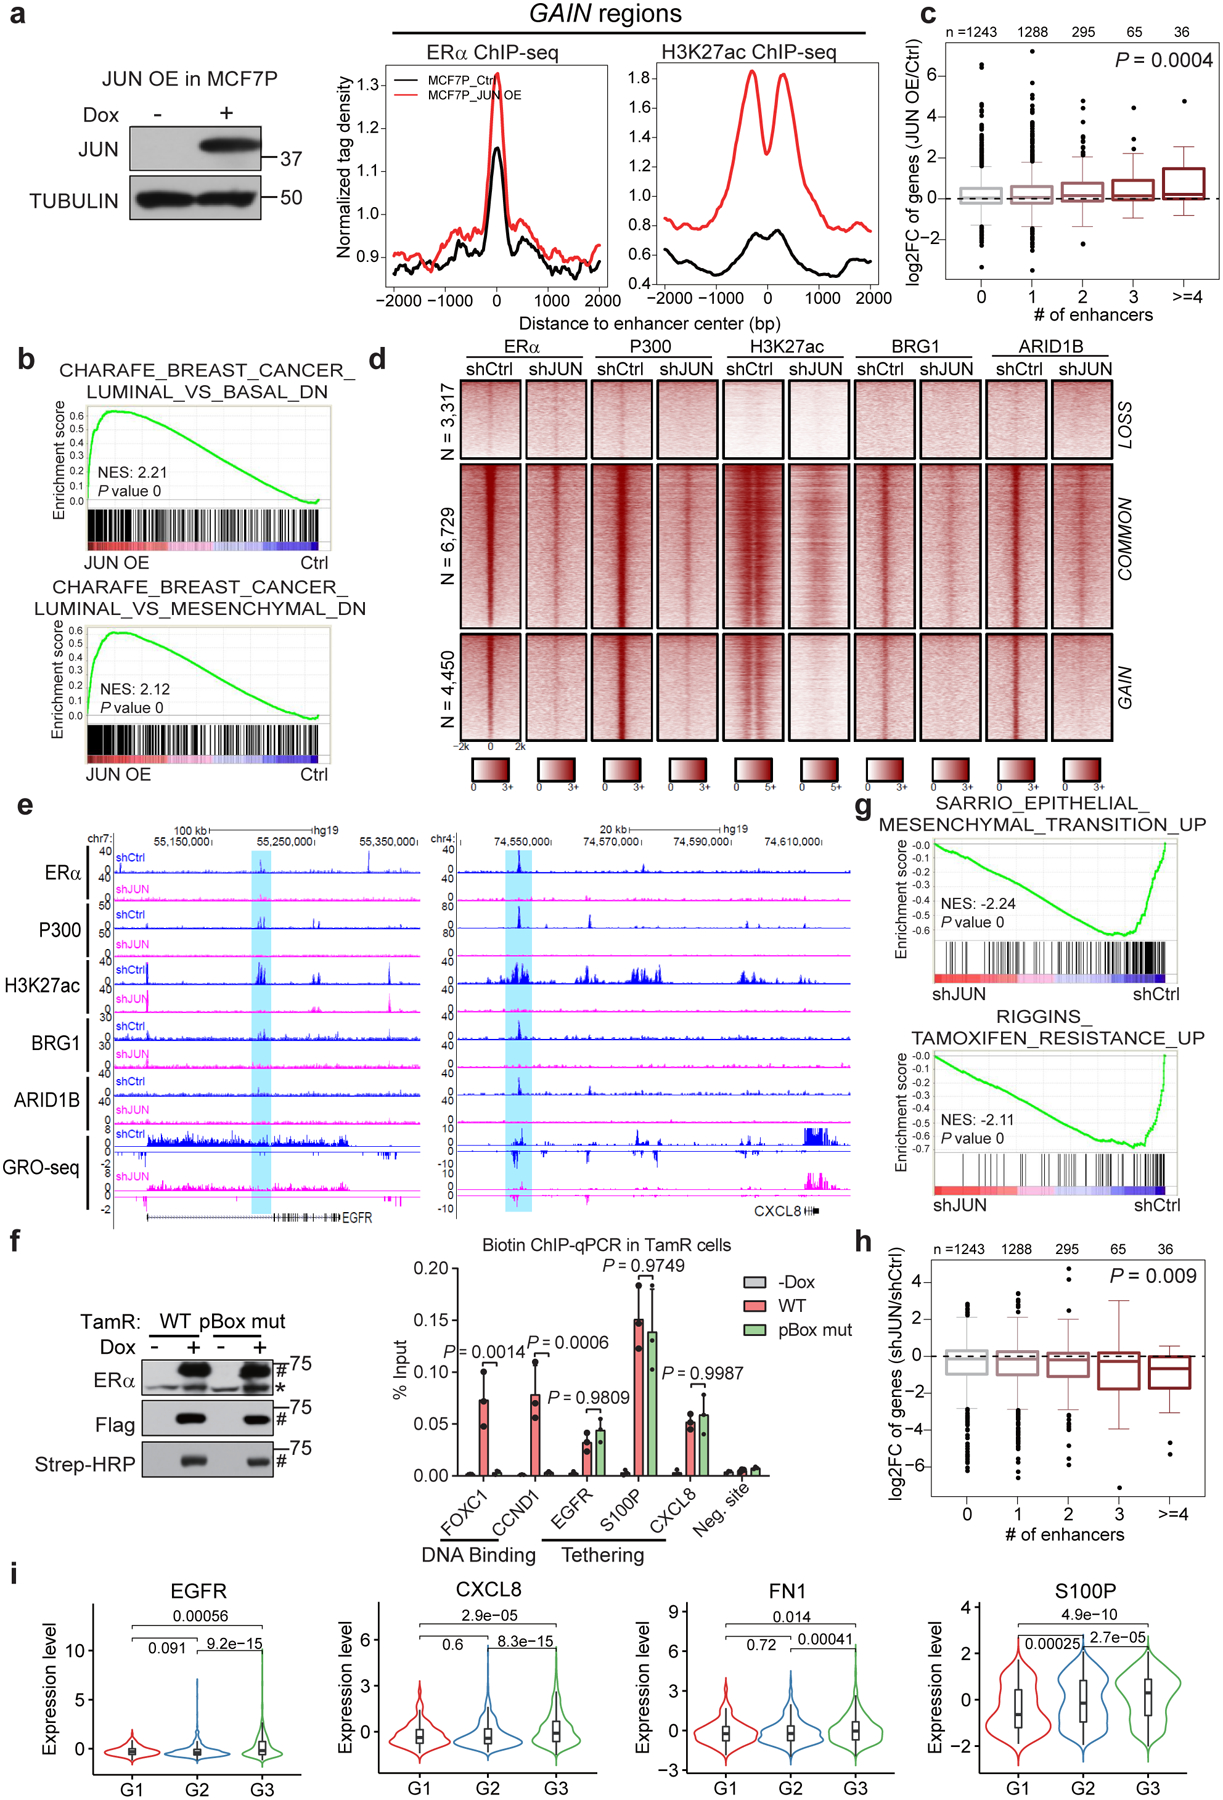
Fig. 6. AP1-mediated GAIN enhancer activation promotes endocrine resistance-associated gene program and phenotypes.

a, Aggregate plots showing the normalized tag density of ERα and H3K27ac ChIP-seq data at GAIN enhancers in MCF7P (right). Western blot confirms the doxycycline-induced JUN expression (left).
b, GSEA analyses of RNA-seq data from MCF7P with or without JUN OE. Empirical gene-based permutation test.
c, Box plots representation of JUN OE effects on expression changes of genes stratified by the numbers of nearest JUN-bound GAIN enhancers within 200 kb from the TSS site of each gene. ANOVA analysis.
d, Heatmaps of ChIP-seq data in TamR cells. JUN KD greatly deactivated GAIN enhancers and caused the loss of chromatin remodeling factors (BRG1 and ARID1B).
e, Genome browser views of GRO-seq and ChIP-seq data. Depleting JUN in TamR cells leads to enhancer inactivation (shaded areas) and transcriptional downregulation at gene bodies.
f, Western blots (left) showing that doxycycline-induction and in vivo biotinylation of BLRP-tagged ERα. *: endogenous ERα, #: tagged exogenous ERα. Biotin ChIP-qPCR (right) shows that ERα binding on GAIN enhancers (EGFR, S100P and CXCL8) was not affected by pBox mutation, unlike the binding to ERE-containing enhancers at FOXC1 and CCND1. n=3 independent experiments, mean ± s.d, two-sided t-tests.
g, GSEA analyses on RNA-seq data. EMT and tamoxifen resistance-related gene signatures were downregulated upon JUN KD in TamR cells. Empirical gene-based permutation test.
h, Box plots showing JUN KD effects on genes stratified by the numbers of nearest JUN-bound GAIN enhancers within 200 kb from the TSS site of each gene. ANOVA analysis.
i, The average gene expression values of the indicated JUN direct targets positively correlate with tumor grades (G1=169, G2=767 and G3=951). METABRIC dataset were used. Two-sided Wilcoxon rank-sum test.
For the box plots in c, h and i, the lower and upper hinges correspond to the first and third quartiles, and the midline represents the median. The upper and lower whiskers extend from the hinge up to 1.5 * IQR (inter-quartile range). Outlier points are indicated if they extend beyond this range.
Immunoblots are representative of two independent experiments. Unprocessed immunoblots are shown in Source Data Fig. 6. Statistical source data are available in Statistical Source Data Fig. 6.
