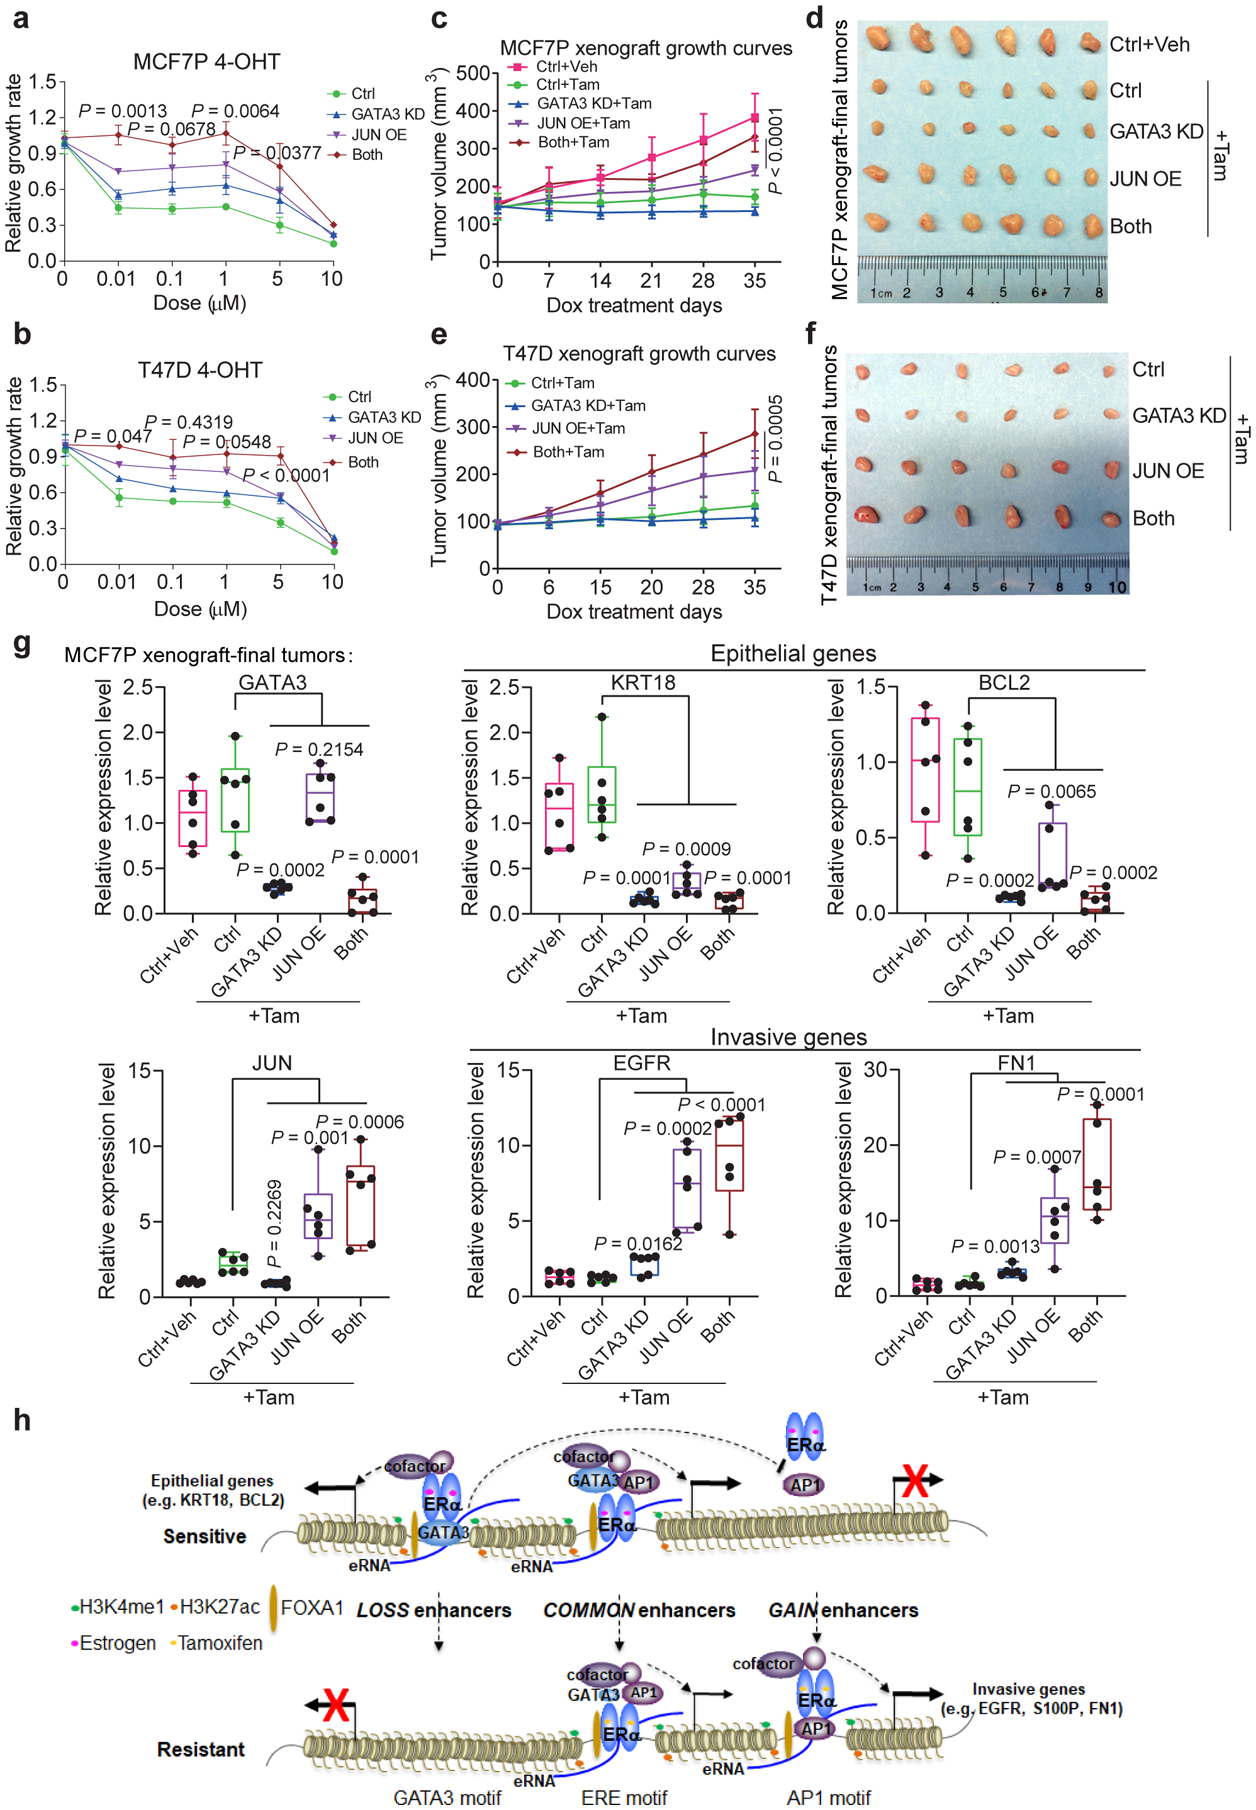
Fig. 8. GATA3 and AP1 cooperate to regulate endocrine resistance and tumor growth in vitro and in vivo.

a, b, CCK8 assays using MCF7P (a) or T47D (b) stable cell lines expressing shGATA3 and/or JUN OE construct to measure relative cell viability with indicated treatments for 5 days to show the combined effect of GATA3 KD and JUN OE on the resistance to 4-OHT. n=3 independent experiments, mean ± s.d., two-sided t-tests.
c, e, Tumor growth curves of orthotopic xenografts of manipulated MCF7P (c, n=5 per group) and T47D (e, n=4 per group) cells in nude mice. Cells with JUN OE showed enhanced tumor growth, which was further enhanced by GATA3 KD. Tamoxifen subcutaneously injections were performed right after the graft (1 mg/mouse, three times/week). Tumor sizes were measured once a week upon starting doxycycline (administrated in water). Statistics: mean ± s.d., two-sided t-tests.
Based on the statistical analyses, GATA3 KD alone was not able to significantly promote or inhibit tumor growth in vitro or in vivo. P values from one-way ANOVA were calculated for GATA3 KD alone vs control: p=0.0604 for a, p=0.2007 for b, p=0.0987 for c, and p=0.0831 for e.
d, f, Images of representative MCF7P (d) and T47D (f) xenograft tumors collected at the end points of the experiments in panel c and e.
g, RT-qPCR analyses of selected epithelial markers and invasion-related genes in MCF7P xenograft tumors with indicated treatments, showing the coordinate role of GATA3 and JUN in regulating gene expression in vivo in the xenograft tumors. Data are presented as mean ± s.d. from n=6 independent samples. P values were determined by two-sided t-tests. The box plot elements represent the minimum, 25th percentile, median, 75th percentile, and maximum values.
h, A proposed model of high-order assemblies of TFs in regulating enhancer reprogramming. Enhancer reprogramming mediated by the altered interactions between ERα and other TFs (exemplified by FOXA1, GATA3 and AP1) promote phenotypic plasticity during the acquisition of therapy resistance and invasive progression.
Statistical source data are available in Statistical Source Data Fig. 8.
