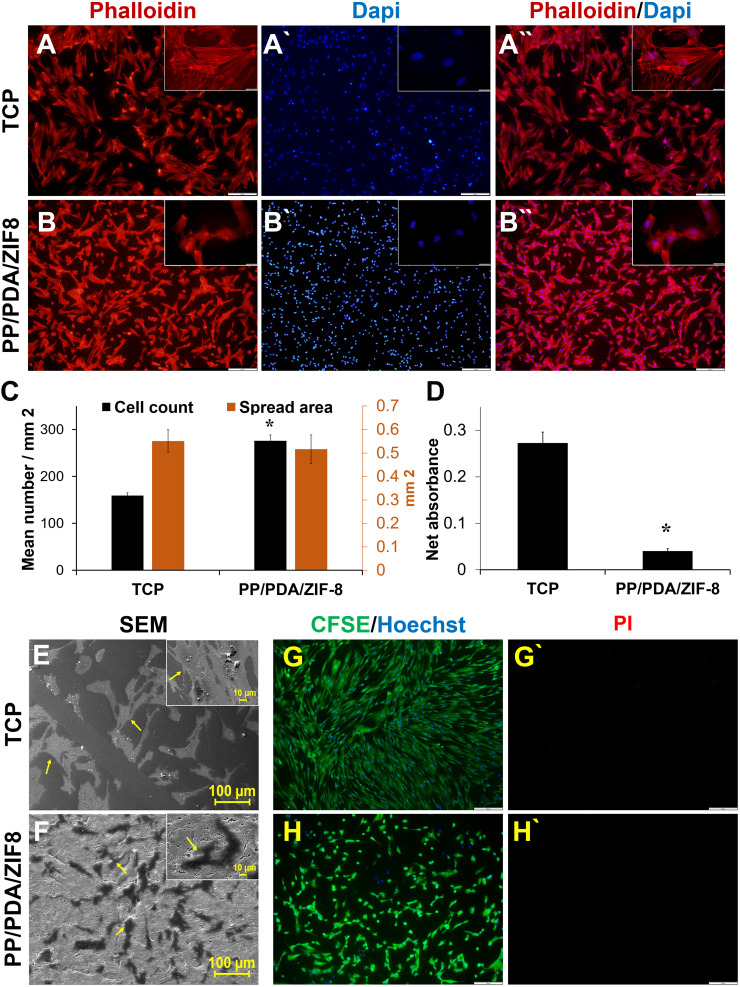
Figure 2.
Cellular attachment and viability analysis of DPSCs on the ZIF-8 modified substrate. F-actin arrangement of DPSCs cultured on (A) TCP and (B) PP/PDA/ZIF-8 substrates after one day. F-actin filaments were visualized via labeling with phalloidin-TRITC (red), and nuclei were stained with DAPI (blue). Scale bar = 200 µm. Magnified inserts showed the typical morphological features of cells on each substrate. Scale bar = 20 µm. (C) Bar graph presenting the quantification of cell count (black bar) and cell spread area (brown bar). (D) Analysis of cell metabolic activity was carried out after 8 hours, using MTS assay. SEM imaging of cultured cells on (E) TCP and (F) PP/PDA/ZIF-8 substrates, following one-day incubation in normal culture condition. The viability of cultured DPSCs was evaluated on (G) TCP and (H) PP/PDA/ZIF-8 substrates on day 1. Viable cells are stained in green as the result of CFSE cleavage, while dead cells are showed by PI-positive cells (red points). Quantified data are represented as mean ± SEM from three independent experiments, * p<0.05.

