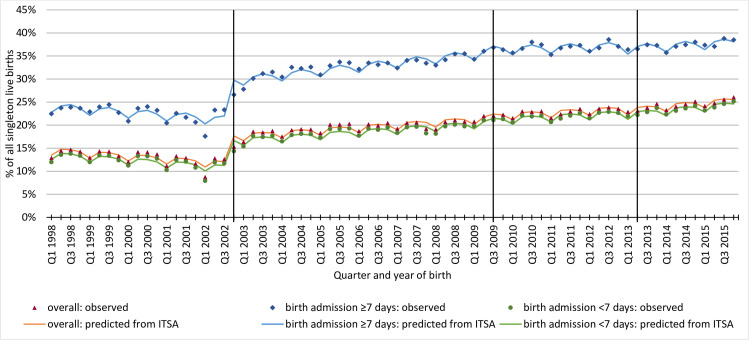
Fig 2. Trends in the proportion of infants with at least one hospital admission after birth in infancy by quarter and year of birth.
HES = Hospital Episode Statistics, ITSA = Interrupted time series analysis. Vertical lines indicate time points when the collection of identifiers used to generate HESID has changed: 1) Q4 2002: implementation of NHS Numbers for Babies service 2) Q3 2009: Introduction of registration online system 3) Q2 2013: correcting postcode extraction error by NHS Digital.

