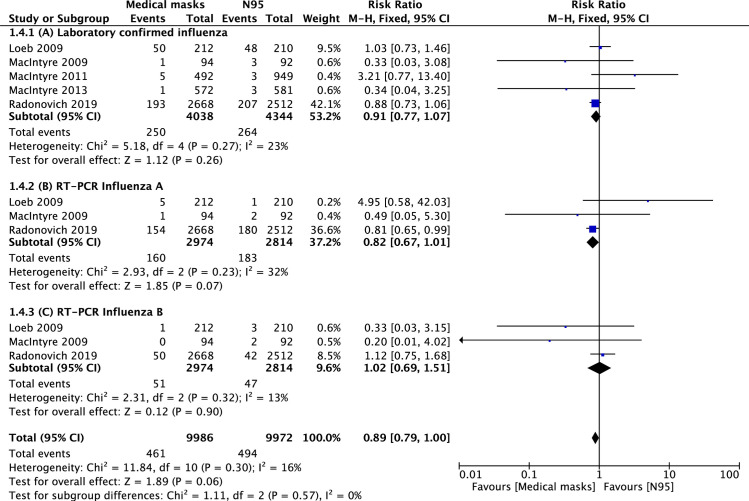
Fig 2.
Forest plot of: (2A) laboratory confirmed influenza in medical masks vs. N95 groups; (2B) laboratory confirmed influenza A; (2C) laboratory confirmed influenza B. The center of each square represents the weighted mean difference for individual trials, and the corresponding horizontal line stands for 95% confidence interval. The diamonds represent pooled results.

