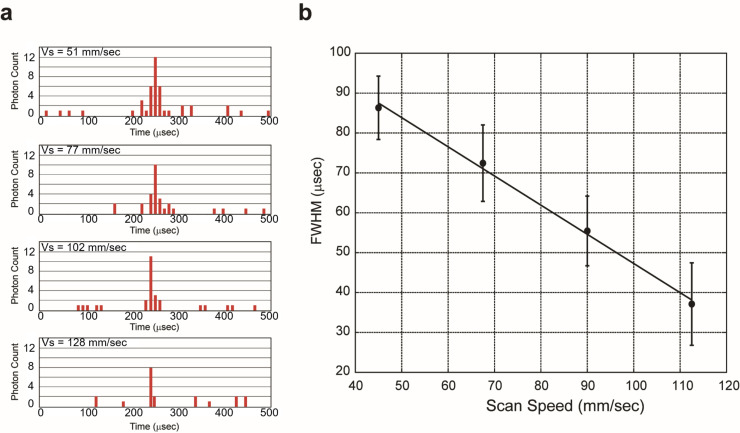
Fig 3. Evaluation of single molecule detection by scanning of confocal region.
(A) Typical photon pulse series obtained by scanning a 1 pM ATTO 647N solution. From top to bottom, the speeds are 51 mm/s, 77 mm/s, 102 mm/s, and 128 mm/s, respectively. (B) Relationship between scanning speed and FWHM of signal pulse. Measuring 1 pM ATTO 647N solution at scanning speeds (Vs) of 45 to 110 mm/s. The average FWHM of signals fitting the Gaussian function was plotted. Error bars are the SD calculated from around 100,000 peaks of three measurements.

