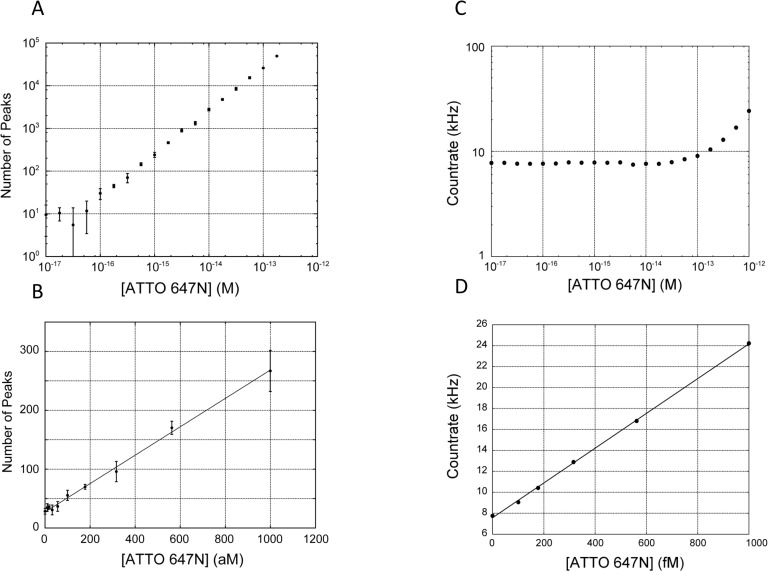
Fig 4. Comparison of LOD between conventional methods and SSMC analysis.
(A) Log-log plot of ATTO 647N measurement by SSMC method. Raw traces of photon count for each concentration are shown as S3 Fig. (B) Plot for 0 to 1000 aM ATTO 647N. The number of peaks detected was converted for a measurement time of 600 s. Error bars are the SD of three measurements. The detection limit was 62 aM based on 3SD of the background. (Linear fit y = 0.24x + 28, R2 = 0.996 by SSMC analysis) (C) Log-log plot of the dye concentration in the range of ATTO 647N 10−17 to 10−12 and the countrate. (D) Plots in the range of ATTO 647N 0 to 1 pM (y = 16.6x + 7.55, R2 = 0.995) and the detection limit was 12 fM.

